
This is part two of a three-part series on IBM Planning Analytics new Forecasting feature.
In our first blog about Planning Analytics’ new Forecasting feature, we reviewed the steps required to configure your forecast. Once configured, you can then preview your forecast before to get a better idea of the results prior to populating the cube.
- Open the PAW book that contains your forecast view.
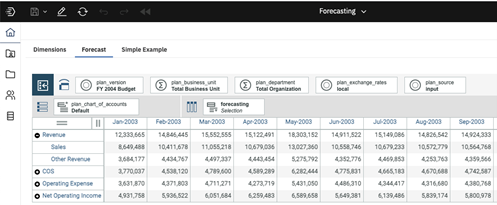
- Click anywhere on the view to activate it. Then click the Forecast icon in the ribbon at the top of the screen. This will open the Forecast window on the right-hand side of your screen. Configure the forecast settings if you have not already done so.
- Click on one of the elements in your row dimension to select the row. Then click the Preview button in the Forecast window on the right-hand side of your screen.
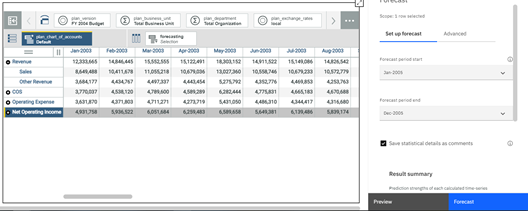
- The Forecast preview window will open. There are two tabs with information about the forecast:
a. Preview chart
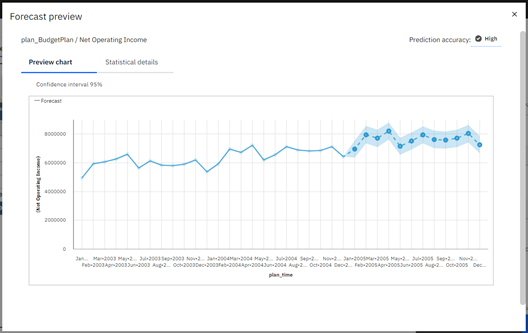
The Preview chart depicts displays the forecasted data, along with a surrounding shaded area. There is a 95% chance that the actual values will fall in this shaded area (or cloud).
b. Statistical details
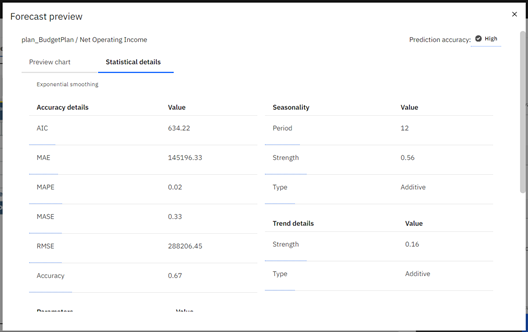
The Statistical details tab provides key information used by the model to forecast your data. Read more about these values here.
In our next blog post, we will review how to run your Planning Analytics Forecasting model.
IBM Planning Analytics, which TM1 is the engine for, is full of new features and functionality. Not sure where to start? Our team here at Revelwood can help. Contact us for more information at info@revelwood.com. And stay tuned for more Planning Analytics Tips & Tricks weekly in our Knowledge Center and in upcoming newsletters!
Read more IBM Planning Analytics Tips & Tricks:
IBM Planning Analytics Tips & Tricks: Configuring the Time Dimension
IBM Planning Analytics Tips & Tricks: Configuring the Forecast Settings
IBM Planning Analytics Tips & Tricks: Convert Existing View Directly to Reports
