• Skip to main content
  • Skip to footer
Revelwood Logo

Revelwood

Your SUPER-powered WP Engine Site

  • Who We Are
    • About Us
      • Our Company
      • Our Team
      • Partners
    • Careers
      • Join Our Team
  • What We Do
    • Solutions
      • Workday Adaptive Planning
      • IBM Planning Analytics
      • BlackLine
    • Services
      • Implementation Services
      • Customer Care
        • Help Desk
        • System Administration as a Service
      • Training
        • Adaptive Planning Training
        • IBM Planning Analytics / TM1 Training
    • Products
      • DataMaestro
      • LightSpeed
      • IBM Planning Analytics Utilities
  • How We Help
    • Workday Adaptive Planning Use Cases
    • IBM Planning Analytics Use Cases
    • BlackLine Use Cases
    • Client Success Stories
  • How We Think
    • Knowledge Center
    • Events
    • News
  • Contact Us

Workday Adaptive Planning Tips & Tricks

Adaptive Insights Tips & Tricks: Making Your Matrix Report Presentable and Meaningful


Tips & Tricks

February 19, 2020

By Gary Leiffer

In today’s Adaptive Insights Tips & Tricks blog post, I explain how to make your matrix report presentable and meaningful.

The in-application Matrix report writing tool is very powerful and enables you to do almost all the financial reporting your company requires. Adaptive Insights Office Connect (a separate report writing application) uses all the cosmetic and benefits of Excel, enabling boardroom quality report creation. The Matrix report writer can also create cosmetically appealing reports by employing special report properties. Today’s Adaptive Insights Tip & Trick will explore the Element Properties, and the Style and Conditional formatting options.

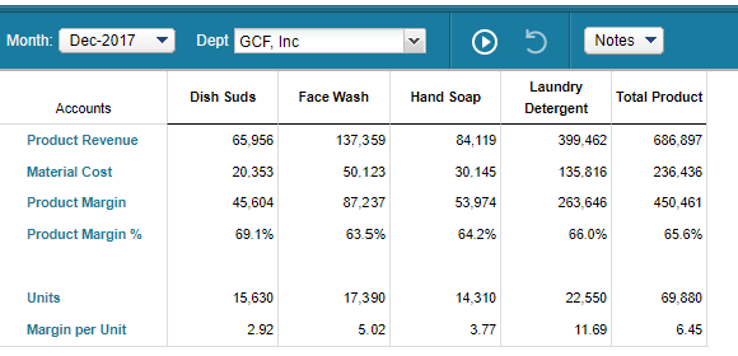
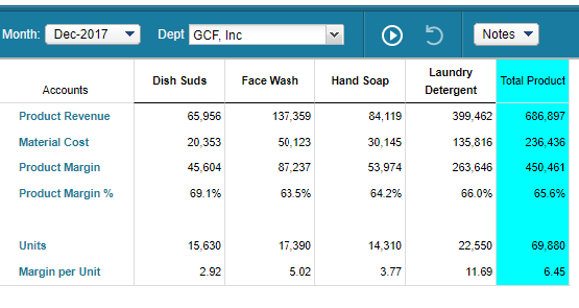
Starting with a basic Matrix report displaying Product data and margins as follows:

Adaptive Insights Tips & Tricks: Matrix Display Options

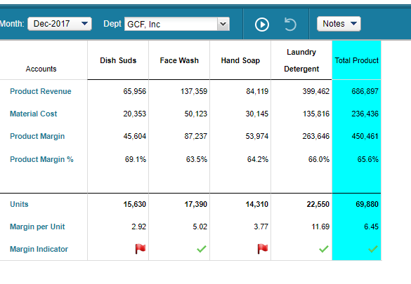
With just a few changes, the final report can look like this:

Adaptive Insights Tips: Matrix Display Options

Here is how it can be created:

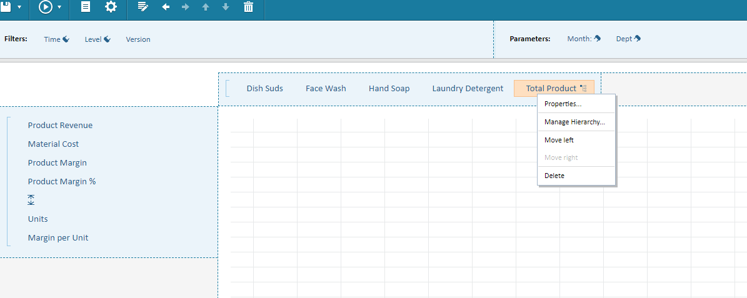
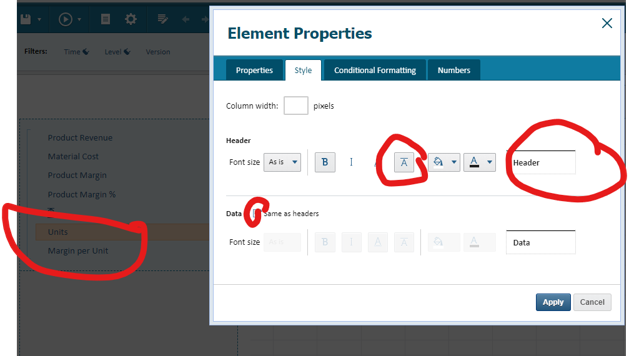
1. To add color or shading to any column or row, (in this example the Total Product Column) right-click on the heading and select properties.

Adaptive Insights Tricks: Matrix Display Options

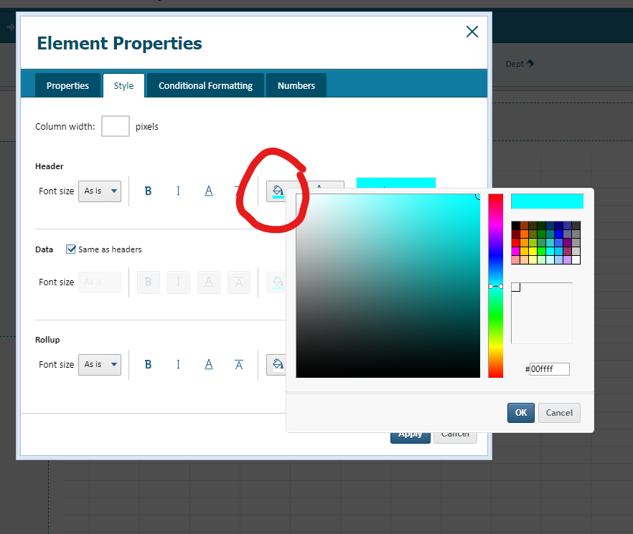
Within the new Element Properties menu select Style and select the circled Background color option- which displays a color palette enabling you to select your color choice for the shading.

Matrix Display Options in Adaptive Insights

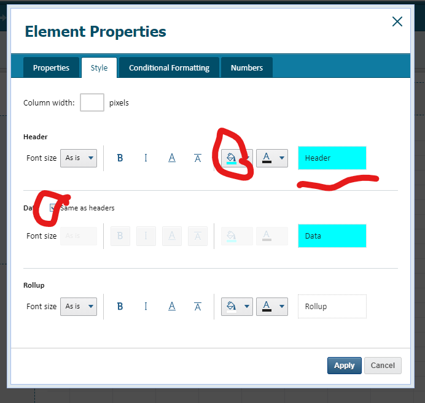
By selecting the Data same as Headers option all the data will be shaded same as the header as follows:

Making Your Adaptive Insight Matrix Report Presentable and Meaningful
Adaptive Insights Matrix Display Options

Selecting the overline option for the header and data displays a line above the Units in this report example:

Adaptive Insights Tips & Tricks

2. To add icons (indicators of good/bad for example) start with data or calculation rows or columns on the report displaying percentages or any data to be “analyzed” as good/bad (in this example it is margin per unit percentage row. Copy the formula and any percentage selections into a new row (or column) and right click on the newly created header.

Learn Adaptive Insights Tips & Tricks
Get Adaptive Insights Tips & Tricks

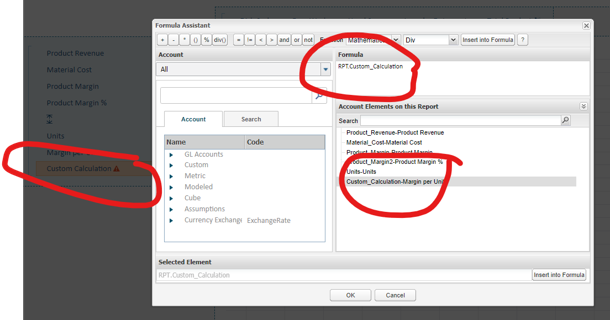
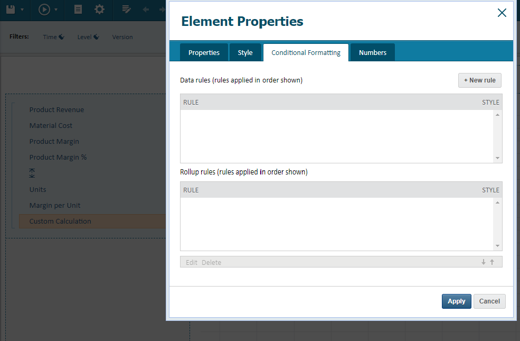
Select conditional formatting to enable the addition of “rules” pertaining the data

Matrix Display Options for Adaptive Insights

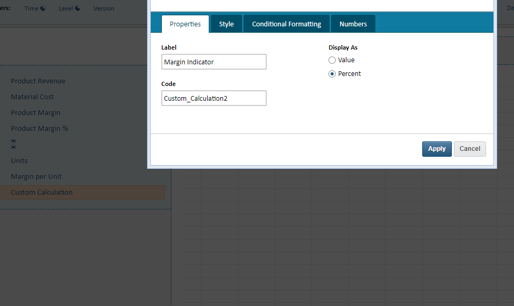
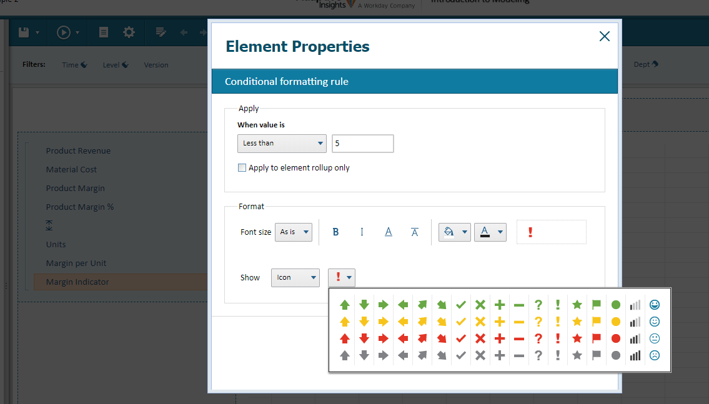
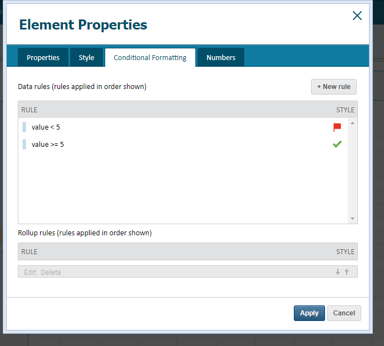
In the first rule I selected “less than” 5 and an icon “Red Flag”

The second rule displays a green check mark for any indicators greater than or equal to 5.

Options for Matrix Display in Adaptive Insights
Tips for Adaptive Insights Matrix Display Options
Tricks for Adaptive Insights Matrix Display Options

In summary, the utilization of some of the advanced features of the Matrix report writing tool enables you to create and enhance your regular and basic financial reports.

The team at Revelwood has been recognized by Adaptive for its thought leadership in the space, commitment to its Adaptive Insights practice, and its rapid achievements of milestones. Visit Revelwood’s Knowledge Center for our Adaptive Insights Tips & Tricks or sign up here to get our Adaptive Insights Tips & Tricks delivered directly to your inbox. Not sure where to start with Adaptive Insights? Our team here at Revelwood can help! Contact us info@revelwood.com for more information.

Learn more Tips & Tricks for using Adaptive Insights:

Adaptive Insights Tips & Tricks: Assumption Sheets

Adaptive Insights Tips & Tricks: Finding Missing Formulas

Adaptive Insights Tips & Tricks: Leveraging your Testing Model

Author

  • Gary Leiffer
    Gary Leiffer

    View all posts

    • Categories

      • Awards & Recognition
      • Financial Close & Consolidation
      • FP&A Done Right
      • IBM Planning Analytics Tips & Tricks
      • News & Events
      • Success Stories
      • Tech Bulletins
      • Workday Adaptive Planning Insights
      • Workday Adaptive Planning Tips & Tricks

    Popular Posts

    Authors

    Adam Riskin
    Adam Riskin
    Ailenette Cruz
    Ailenette Cruz
    Alex Goldman
    Alex Goldman
    Ben Alcock
    Ben Alcock
    Brian Combs
    Brian Combs
    Dave Miersch
    Dave Miersch
    Dillon Rossman
    Dillon Rossman
    Gary Leiffer
    Gary Leiffer
    John Pra Sisto
    John Pra Sisto
    Ken Wolf
    Ken Wolf
    Koury Reid
    Koury Reid
    Lee Lazarow
    Lee Lazarow
    Lisa Minneci
    Lisa Minneci
    Marc Assenza
    Marc Assenza
    Mary Luchs
    Mary Luchs
    Michelle Song
    Michelle Song
    Nina Inverso
    Nina Inverso
    Revelwood
    Revelwood
    Robert Nordhagen
    Robert Nordhagen
    Tara Byrnes
    Tara Byrnes
    Wesley DeMarco
    Wesley DeMarco

    Sign up for our newsletter

    Connect

Footer

Revelwood Overview

Revelwood helps finance organizations close, consolidate, plan, monitor and analyze business performance. As experts in solutions for the Office of Finance, we partner with best-in-breed software companies by applying best practices guidance and our pre-configured applications to help businesses achieve their full potential.

EXPERTISE

  • Workday Adaptive Planning
  • IBM Planning Analytics
  • BlackLine

ABOUT

  • Who We Are
  • What We Do
  • How We Help
  • How We Think
  • Privacy

CONNECT

Contact:

25B Vreeland Road, Suite 111 Florham Park, NJ 07932
201.984.3030
info@revelwood.com

Copyright © 2023 · Revelwood Inc. All rights reserved. Revelwood® and the Revelwood logo are registered marks of Revelwood Inc.