Did you know when creating active form reports, you may sometimes want to separate sections? Some people like to create this separation via dashes or via bold line formatting. Some prefer to create “dummy” elements and use conditional formatting to make them appear like a blank line (although this approach is not recommended). Many clients, however, prefer to have the separation via a blank line.
Unfortunately, there is no easy way to create a blank line. We instead used a different approach with a client to create separation within rows in an Excel-based report.
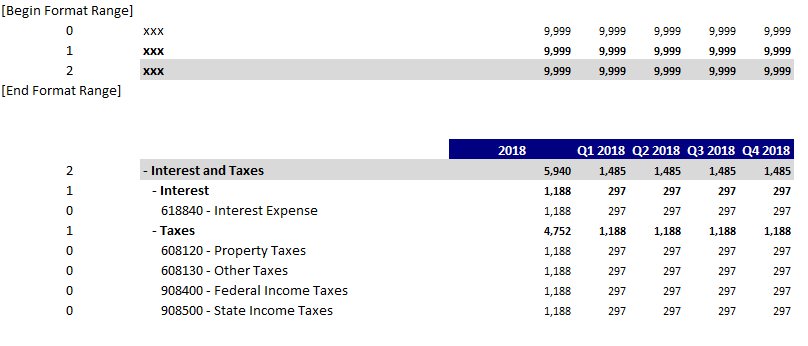
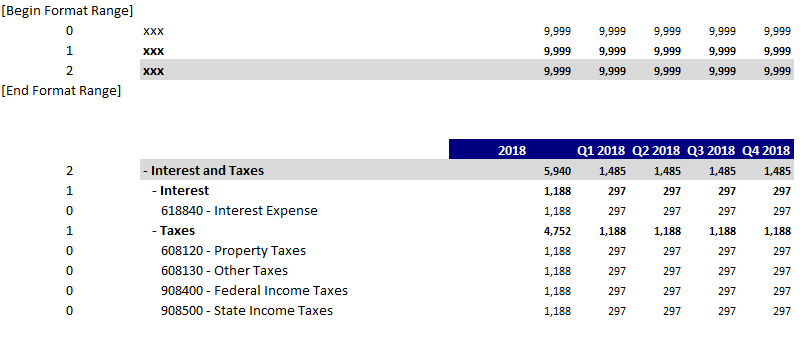
Here is a sample report that we will start with, including the formatting range:

Column 1 references the element level of the account. This is the column that will be used for the formatting. The rest of the report is a standard active form.
We now want to insert a blank area above the level 1 elements (e.g., above the line for Interest and above the line for Taxes).
Step 1: Insert a new column and edit the formatting for the applicable level
- We will insert a new column to the left of the year
- We will then format the new column for level 1 to have a very large font. This report is currently set to use font size 11, so we will set this one cell to use font size 22.
Here is the new formatting area:

Step 2: Within the report, hard code a value into the new column
- Type the letter X into the new column. Remember that you only need to put the letter into the top row since Active Forms will replicate the value when you rebuild the report.
Here is the report after rebuilding it:

There are now blank areas surrounding the rows associated with level 1, but the new formatting is only associated with the one column.
Step 3: Hide the new column
- In addition to hiding the column, you may choose to also manipulate the vertical cell alignment.
Once completed, here is the final report that users will see:

This approach uses formatting to create separation between rows within Excel. When combined with conditional formatting and other references in the first column (e.g. the format definition column), this approach can be both very powerful and very flexible.
IBM Planning Analytics, which TM1 is the engine for, is full of new features and functionality. Not sure where to start? Our team here at Revelwood can help. Contact us for more information at info@revelwood.com. And stay tuned for more Planning Analytics Tips & Tricks weekly in our Knowledge Center and in upcoming newsletters!
Learn more IBM Planning Analytics Tips & Tricks:
IBM Planning Analytics Tips & Tricks: The Ranked Report
IBM Planning Analytics Tips & Tricks: Snap Commands – Spelling
IBM Planning Analytics Tips & Tricks: Snap Commands – Sorting

