• Skip to primary navigation
  • Skip to content
  • Skip to footer
Revelwood

Revelwood

  • Who We Are
    • About Us
      • Our Company
      • Our Team
      • Partners
        • Adaptive Insights
        • IBM
    • Careers
      • Join Our Team
  • What We Do
    • CAPABILITIES
      • Financial Performance Management
      • Business Intelligence
      • Data Science
    • SERVICES
      • Consulting Services
        • Implementation
        • Migration
        • Health Check
        • Report Conversion
      • Customer Care
        • Help Desk
        • System Admin
        • Performance Tune-Up
      • Training
        • Adaptive Insights Training
        • IBM Planning Analytics/TM1 Training
    • PRODUCTS & SOLUTIONS
      • Lightspeed Planning & Reporting
      • Quantum for TM1
  • How We Help
    • Industries We Serve
    • Client Success Stories
    • Revelwood Heroes
  • How We Think
    • Knowledge Center
    • News and Events
    • User Groups
  • Contact Us

IBM Planning Analytics Tips & Tricks: Displaying Data in Maps

IBM Planning Analytics Tips & Tricks

IBM Planning Analytics Tips & Tricks: Displaying Data in Maps


Tips & Tricks

January 3, 2018

By Lee Lazarow

Did you know you can easily visualize data with IBM Planning Analytics Workspace?  IBM Planning Analytics Workspace (PAW) allows you to visualize your data using a variety of charts and graphs, including the ability to display your results via a map.  The only requirement for mapping is to ensure that your geography dimension includes recognizable place names.  IBM defines “recognizable” to include items such as countries, states and provinces and offers a list of acceptable items on their website.

You can create a map in PAW with three easy steps:

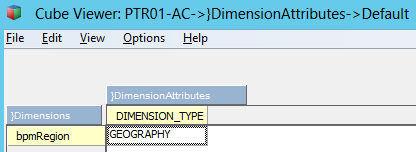
1. Ensure that your dimension type is defined as geography within the }DimensionAttributes cube.

Easily visualize data with IBM Planning Analytics Workspac


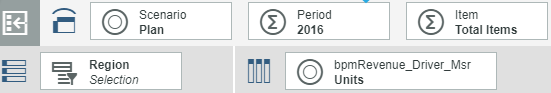
2. Create a view in PAW with either your rows or columns displaying the geography dimension.

Use IBM Planning Analytics to easily display data as maps.


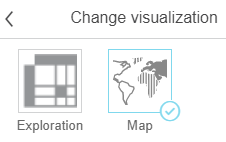
3. Set your visualization type to be a map.

Visualize data with IBM Planning Analytics Workspace


The resulting display will appear as a map:

Use IBM Planning Analytics Workspace to display data in a map.


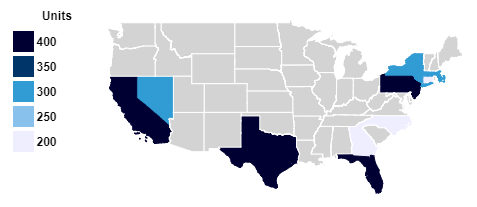
Planning Analytics will re-analyze the data set each time you refresh the values.  If at least 80% of the row or column members are recognized as geographic map values then PAW will re-create the map.  This will allow you to quickly shift between worldwide, nationwide and regional maps by simply changing and suppressing the values you want to display.

IBM Planning Analytics  is full of new features and functionality. Not sure where to start?  Our team here at Revelwood can help.  Contact us for more information at info@revelwood.com.  And stay tuned for more Planning Analytics Tips & Tricks weekly in our Knowledge Center and in upcoming newsletters!


Read more IBM Planning Analytics Tips & Tricks:

Tips & Tricks for using TM1: Variance Analysis in IBM Cognos TM1

IBM Planning Analytics Tips & Tricks: Creating Dynamic, Attractive Views and Dashboards

Tips & Tricks for Using IBM Planning Analytics – Creating TM1/Planning Analytics Picklist Cubes

    Connect

    Sign up for our newsletter

    Categories

    • Adaptive Insights Tips & Tricks
    • Awards & Recognition
    • FP&A Done Right
    • IBM Planning Analytics Tips & Tricks
    • News & Events
    • Success Stories
    • Tech Bulletins
    • Videos

    Authors

    • John Pra Sisto
    • Revelwood
    • Brian Combs
    • Ken Wolf
    • Lee Lazarow
    • Lisa Minneci

Footer

Revelwood Overview

Revelwood helps companies optimize operational performance and financial results through the use of data and analytics. Experts in FP&A process and technology, we combine the industry’s greatest planning and reporting software with best practices and pre-configured, out-of-the-box applications to help businesses achieve their full potential.

download revelwood fact sheet

EXPERTISE

  • Financial Performance Management
  • Business Intelligence
  • Data Science

ABOUT

  • Who We Are
  • What We Do
  • How We Help
  • Privacy

CONNECT

Contact:
25B Vreeland Road, Suite 111
Florham Park, NJ 07932

201.984.3030
info@revelwood.com

© Revelwood Inc. All rights reserved. Revelwood® and the Revelwood logo are registered marks of Revelwood Inc. 

News & Events

Turn Forecasting into a Competitive Adva

News & Events

News & Events

Net Promoter Score and Customer Outcomes

News & Events