• Skip to primary navigation
  • Skip to main content
  • Skip to footer
Revelwood

Revelwood

  • Who We Are
    • About Us
      • Our Company
      • Our Team
      • Partners
    • Careers
      • Join Our Team
  • What We Do
    • SOLUTIONS
      • Workday Adaptive Planning
      • IBM Planning Analytics
      • BlackLine
    • SERVICES
      • Implementation Services
      • Advisory Services
      • Customer Care
        • Help Desk
        • System Admin
        • Performance Tune-Up
      • Training
        • Workday Adaptive Planning Training
        • IBM Planning Analytics / TM1 Training
    • PRODUCTS
      • DataMaestro
      • Lightspeed Planning & Reporting
      • IBM Planning Analytics Utilities
  • How We Help
    • Workday Adaptive Planning Use Cases
    • IBM Planning Analytics Use Cases
    • Client Success Stories
  • How We Think
    • Knowledge Center
    • Events
    • News
    • User Groups
  • Contact Us

IBM Planning Analytics Tips & Tricks: Excel Workbook Stats

IBM Planning Analytics Tips & Tricks

IBM Planning Analytics Tips & Tricks: Excel Workbook Stats


Tips & Tricks

May 3, 2022

By Lee Lazarow

Have you ever wanted to know details about your existing worksheet or workbook such as the number of cells that contain data or the number of total sheets? In 2021, Microsoft Excel introduced a feature called Workbook Statistics that will provide details about your file.

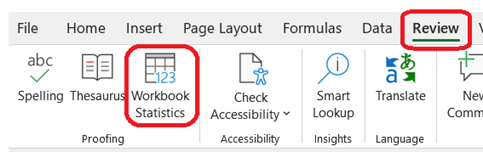
The Workbook Statistics icon is found within the proofing area of the Review ribbon.

Excel Workbook Stats

When the icon is clicked, a window appears to show details about the sheet. The following statistics are shown:

Worksheet level  

  • End of sheet / Last cell
  • Number of Cells with Data
  • Number of Tables
  • Number of PivotTables
  • Number of Formulas
  • Number of Charts
  • Number of Images
  • Number of Form Controls
  • Number of Objects
  • Number of Comments
  • Number of Notes

Workbook level  

  • Number of Sheets
  • Number of Cells with Data
  • Number of Tables
  • Number of PivotTables
  • Number of Formulas
  • Number of Charts
  • Number of External Connections
  • Number of Macros

Here is an example of a simple sheet that contains  some input cells, some calculations, and a header row:

Excel Workbook Stats

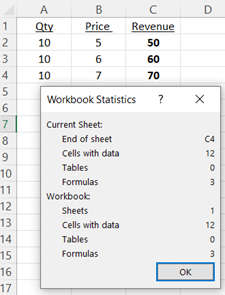
Not only will these details help you with generic Excel related questions, but the “end of sheet” and “cells with data” details can also assist when reviewing your dynamic reporting setups.

IBM Planning Analytics, which TM1 is the engine for, is full of new features and functionality. Not sure where to start? Our team here at Revelwood can help. Contact us for more information at info@revelwood.com. And stay tuned for more Planning Analytics Tips & Tricks weekly in our Knowledge Center and in upcoming newsletters!

Read more Excel Tips & Tricks:

IBM Planning Analytics Tips & Tricks: Correctly Sum Rounded Numbers in Excel

IBM Planning Analytics Tips & Tricks: Excel Keyboard Navigation

IBM Planning Analytics Tips & Tricks: Excel OFFSET Function

    • Categories

      • Awards & Recognition
      • FP&A Done Right
      • IBM Planning Analytics Tips & Tricks
      • Modern Accounting
      • News & Events
      • Success Stories
      • Tech Bulletins
      • Workday Adaptive Planning Insights
      • Workday Adaptive Planning Tips & Tricks

    Popular Posts

    • Workday Adaptive Planning Tips & Tricks: The Formula Assistant – How To, Where & Why
    • IBM Planning Analytics Tips & Tricks: Troubleshooting Planning Analytics for Excel
    • Workday Adaptive Planning Tips & Tricks: Templates
    • Workday Adaptive Planning Named a Leader in Gartner Magic Quadrant for Cloud Financial Planning and Analysis Solutions 2020
    • Workday Adaptive Planning Tips & Tricks: Excel Reporting Using a Report Template

    Sign up for our newsletter

    Connect

    Authors

    • John Pra Sisto
    • Revelwood
    • Adam Riskin
    • Brian Combs
    • Dave Miersch
    • Dillon Rossman
    • Gary Leiffer
    • Ken Wolf
    • Koury Reid
    • Lee Lazarow
    • Lisa Minneci
    • Marc Assenza
    • Mary Luchs
    • Michelle Song
    • Nina Inverso
    • Summer Jeter
    • Tara Byrnes
    • Thanh Chau
    • Wesley DeMarco

Footer

Revelwood Overview

Revelwood helps finance organizations close, consolidate, plan, monitor and analyze business performance. As experts in solutions for the Office of Finance, we partner with best-in-breed software companies by applying best practices guidance and our pre-configured applications to help businesses achieve their full potential.

EXPERTISE

  • Workday Adaptive Planning
  • IBM Planning Analytics
  • BlackLine

ABOUT

  • Who We Are
  • What We Do
  • How We Help
  • How We Think
  • Privacy

CONNECT

Contact:
25B Vreeland Road, Suite 111
Florham Park, NJ 07932

201.984.3030
info@revelwood.com

© Revelwood Inc. All rights reserved. Revelwood® and the Revelwood logo are registered marks of Revelwood Inc. 

Technical Bulletin: Apache Log4j Vulnerability Impact on IBM Planning Analytics Models

Technical Bulletin: Changes to the IBM P

Tech Bulletins

FP&A Done Right

FP&A Done Right: ESG Reporting Tool

FP&A Done Right