• Skip to main content
  • Skip to footer
Revelwood Logo

Revelwood

Your SUPER-powered WP Engine Site

  • Who We Are
    • About Us
      • Our Company
      • Our Team
      • Partners
    • Careers
      • Join Our Team
  • What We Do
    • Solutions
      • Workday Adaptive Planning
      • IBM Planning Analytics
      • BlackLine
    • Services
      • Implementation Services
      • Customer Care
        • Help Desk
        • System Administration as a Service
      • Training
        • Adaptive Planning Training
        • IBM Planning Analytics / TM1 Training
    • Products
      • DataMaestro
      • LightSpeed
      • IBM Planning Analytics Utilities
  • How We Help
    • Workday Adaptive Planning Use Cases
    • IBM Planning Analytics Use Cases
    • BlackLine Use Cases
    • Client Success Stories
  • How We Think
    • Knowledge Center
    • Events
    • News
  • Contact Us

IBM Planning Analytics Tips & Tricks

IBM Planning Analytics Tips & Tricks: PAW Chart Show Totals


Tips & Tricks

July 19, 2022

By Dillon Rossman

One of IBM Planning Analytics’ purposes is to serve as an aggregation tool. As a result, many of your explorations consist of a series of base level elements plus a total. Here is an example of a simple exploration that shows details of a list of companies plus a total:

Table

Description automatically generated

This exploration can easily be converted into a pie chart by simply changing the visualization to a pie chart. Here is what the pie chart will look like:

Chart, pie chart

Description automatically generated

However, the concept of aggregations has now shifted into a detriment since the total will always appear as 50% of the chart! Planning Analytics Workspace (PAW) allows you to hide the totals by defining properties within each field of your chart. You can do this via the following steps:

  1. While in Edit mode, single click on your pie chart widget.
  1. Select the option for “Fields” at the top, right corner. Not all visualizations use fields, so this may appear blank if you have not yet converted your widget to a pie chart.
  1. Click the three vertical dots associated with the dimension that should not include totals. In my example, the segment is associated with the company dimension.
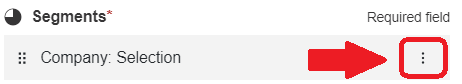
  1. Select the option to Hide Totals.

Once selected, the same pie chart will look like this:

Chart, pie chart

Description automatically generated

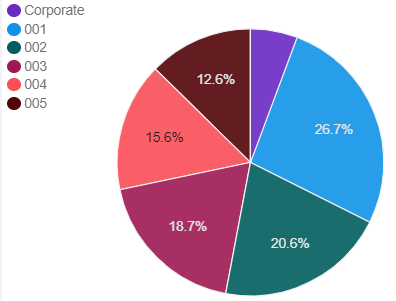
This approach will allow you to properly define when you want a total to appear, thereby making your chart results beneficial to the user.

Revelwood has worked with IBM Planning Analytics / TM1 for more than 27 years. We’ve partnered with hundreds of companies on the design, development, maintenance and updates of IBM Planning Analytics applications, across every industry. Have a challenge with Planning Analytics / TM1? We can help you!

Read more IBM Planning Analytics Tips & Tricks:

IBM Planning Analytics Tips & Tricks: Displaying Percentages on a Planning Analytics Workspace (PAW) Pie Chart

IBM Planning Analytics Tips & Tricks: PAW Pie Percent or Value?

IBM Planning Analytics Tips & Tricks: PAW Explorations – Row & Column Headers

Author

  • Dillon Rossman
    Dillon Rossman

    View all posts

    • Categories

      • Awards & Recognition
      • Financial Close & Consolidation
      • FP&A Done Right
      • IBM Planning Analytics Tips & Tricks
      • News & Events
      • Success Stories
      • Tech Bulletins
      • Workday Adaptive Planning Insights
      • Workday Adaptive Planning Tips & Tricks

    Popular Posts

    Authors

    Adam Riskin
    Adam Riskin
    Ailenette Cruz
    Ailenette Cruz
    Alex Goldman
    Alex Goldman
    Ben Alcock
    Ben Alcock
    Brian Combs
    Brian Combs
    Dave Miersch
    Dave Miersch
    Dillon Rossman
    Dillon Rossman
    Gary Leiffer
    Gary Leiffer
    John Pra Sisto
    John Pra Sisto
    Ken Wolf
    Ken Wolf
    Koury Reid
    Koury Reid
    Lee Lazarow
    Lee Lazarow
    Lisa Minneci
    Lisa Minneci
    Marc Assenza
    Marc Assenza
    Mary Luchs
    Mary Luchs
    Michelle Song
    Michelle Song
    Nina Inverso
    Nina Inverso
    Revelwood
    Revelwood
    Robert Nordhagen
    Robert Nordhagen
    Tara Byrnes
    Tara Byrnes
    Wesley DeMarco
    Wesley DeMarco

    Sign up for our newsletter

    Connect

Footer

Revelwood Overview

Revelwood helps finance organizations close, consolidate, plan, monitor and analyze business performance. As experts in solutions for the Office of Finance, we partner with best-in-breed software companies by applying best practices guidance and our pre-configured applications to help businesses achieve their full potential.

EXPERTISE

  • Workday Adaptive Planning
  • IBM Planning Analytics
  • BlackLine

ABOUT

  • Who We Are
  • What We Do
  • How We Help
  • How We Think
  • Privacy

CONNECT

Contact:

25B Vreeland Road, Suite 111 Florham Park, NJ 07932
201.984.3030
info@revelwood.com

Copyright © 2023 · Revelwood Inc. All rights reserved. Revelwood® and the Revelwood logo are registered marks of Revelwood Inc.