• Skip to main content
  • Skip to footer
Revelwood Logo

Revelwood

Your SUPER-powered WP Engine Site

  • Who We Are
    • About Us
      • Our Company
      • Our Team
      • Partners
    • Careers
      • Join Our Team
  • What We Do
    • Solutions
      • Workday Adaptive Planning
      • IBM Planning Analytics
      • BlackLine
    • Services
      • Implementation Services
      • Customer Care
        • Help Desk
        • System Administration as a Service
      • Training
        • Workday Adaptive Planning Training
        • IBM Planning Analytics / TM1 Training
    • Products
      • DataMaestro
      • LightSpeed
      • IBM Planning Analytics Utilities
  • How We Help
    • Use Cases
    • Client Success Stories
  • How We Think
    • Knowledge Center
    • Events
    • News
  • Contact Us

IBM Planning Analytics Tips & Tricks

IBM Planning Analytics Tips & Tricks: PAW Pie Chart Total


Tips & Tricks from Revelwood

January 23, 2024

By Lee Lazarow

Pie charts are a type of visualization known as composition. Composition charts are designed to show the parts of a whole. This is a great way to look at the pieces of total. For example, the branches in a region or the months in a year.

Here is an example of a pie chart that shows operating expenses for a year:

IBM Planning Analytics Tips & Tricks: PAW Pie Chart Total

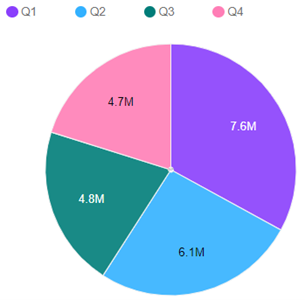
The great thing about this chart is that you can easily see the numbers for each quarter. I can also quickly see comparative values such as Q1 being much larger than Q4. However, what I cannot see is the total for the year.

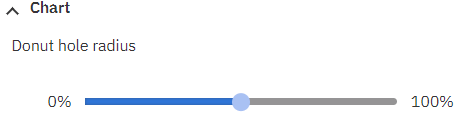
IBM Planning Analytics Workspace allows you to include a “donut hole” and include the total in the center of the pie. This is enabled within the chart area of the properties by defining the radius percent.

IBM Planning Analytics Tips & Tricks: PAW Pie Chart Total

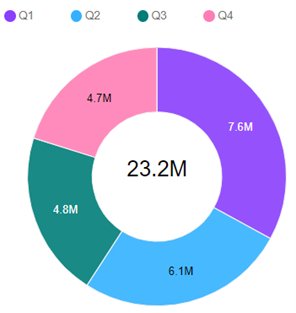
When combined with the option to “show inner label”, here is an example of the same chart with a donut hole of 50%:

IBM Planning Analytics Tips & Tricks: PAW Pie Chart Total

This approach will help you expand your use of comparative pie charts.

IBM Planning Analytics, which TM1 is the engine for, is full of new features and functionality. Not sure where to start? Our team here at Revelwood can help. Contact us for more information at info@revelwood.com. And stay tuned for more Planning Analytics Tips & Tricks weekly in our Knowledge Center and in upcoming newsletters!

Read more about visualizations in IBM Planning Analytics:

IBM Planning Analytics Tips & Tricks: Scatter Chart vs Bubble Chart

IBM Planning Analytics Tips & Tricks: The Waterfall Chart

IBM Planning Analytics Tips & Tricks: Pie Chart Sizing

Author

  • Lee Lazarow

    View all posts
    • Categories

      • Accounting and Accounts Receivable
      • Awards & Recognition
      • Data Analytics in Finance
      • Financial Close & Consolidation
      • FP&A Done Right
      • IBM Planning Analytics Tips & Tricks
      • News & Events
      • Success Stories
      • Tech Bulletins
      • Workday Adaptive Planning Insights
      • Workday Adaptive Planning Tips & Tricks

    Popular Posts

    Authors

    Adam Riskin
    Adam Riskin
    Brian Colucci
    Brian Colucci
    Brian Combs
    Brian Combs
    Cameron Burke
    Cameron Burke
    Dave Miersch
    Dave Miersch
    Ivan Cepero
    Ivan Cepero
    John Pra Sisto
    John Pra Sisto
    Jonathan Dunn
    Jonathan Dunn
    Ken Wolf
    Ken Wolf
    Lee Lazarow
    Lee Lazarow
    Lisa Minneci
    Lisa Minneci
    Luke Griffie
    Luke Griffie
    Marc Assenza
    Marc Assenza
    Mary Luchs
    Mary Luchs
    Michael Mari
    Michael Mari
    Michelle Song
    Michelle Song
    Revelwood
    Revelwood
    Robert Nordhagen
    Robert Nordhagen
    Simon Foley
    Simon Foley
    Thomas McDade
    Thomas McDade

    Sign up for our newsletter

    Connect

Footer

Revelwood Overview

Revelwood helps finance organizations close, consolidate, plan, monitor and analyze business performance. As experts in solutions for the Office of Finance, we partner with best-in-breed software companies by applying best practices guidance and our pre-configured applications to help businesses achieve their full potential.

EXPERTISE

  • Workday Adaptive Planning
  • IBM Planning Analytics
  • BlackLine

ABOUT

  • Who We Are
  • What We Do
  • How We Help
  • How We Think
  • Privacy

CONNECT

World Headquarters

Florham Park, NJ | 201 984 3030

European Headquarters

London & Edinburgh | +44 (0)131 240 3866

Latin America Office

Miami, FL | 201 987 4198

Email
info@revelwood.com

Copyright © 2025 · Revelwood Inc. All rights reserved. Revelwood® and the Revelwood logo are registered marks of Revelwood Inc.