• Skip to main content
  • Skip to footer
Revelwood Logo

Revelwood

Your SUPER-powered WP Engine Site

  • Who We Are
    • About Us
      • Our Company
      • Our Team
      • Partners
    • Careers
      • Join Our Team
  • What We Do
    • Solutions
      • Workday Adaptive Planning
      • IBM Planning Analytics
      • BlackLine
    • Services
      • Implementation Services
      • Customer Care
        • Help Desk
        • System Administration as a Service
      • Training
        • Workday Adaptive Planning Training
        • IBM Planning Analytics / TM1 Training
    • Products
      • DataMaestro
      • LightSpeed
      • IBM Planning Analytics Utilities
  • How We Help
    • Use Cases
    • Client Success Stories
  • How We Think
    • Knowledge Center
    • Events
    • News
  • Contact Us

IBM Planning Analytics Tips & Tricks

IBM Planning Analytics Tips & Tricks: Scatter Chart vs Bubble Chart


Tips & Tricks

July 20, 2021

By Lee Lazarow

A scatter chart is used to show relationships within your data. This type of chart is great to see patterns and groupings over a large set of values. A bubble chart is also used to show relationships and it also great to see patterns. So what is the difference between the two types of charts?

A scatter chart is used to show the correlation of two data sets that have different ranges of values. The IBM Planning Analytics Workspace (PAW) example below shows the correlation of revenue and gross profit.

IBM Planning Analytics Tips & Tricks: Scatter vs Bubble

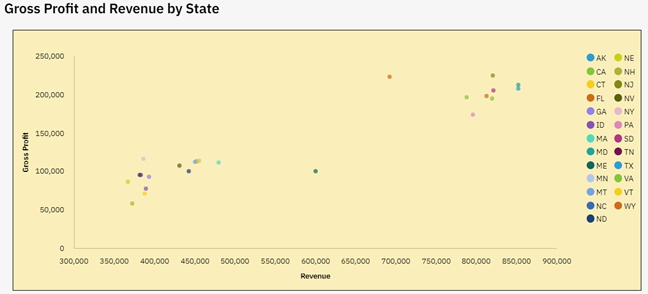
The values associated with gross profit range from approx. 50,000 to 250,000. The values associated with revenue range from approx. 350,000 to 850,000. The scatter chart allows you to put these two different data sets onto the same chart and therefore see patterns. In this case, we see a positive correlation between larger revenue and larger profit … thereby telling us that our indirect costs are somewhat symmetrical to our direct costs.

But what if we also want to know how the number of units impacts these numbers? This cannot be done on a simple two dimensional chart, but it can be done by adjusting the size of the dots within the chart. This adjustment approach is the purpose of a PAW bubble chart.

Here is the same set of data with the inclusion of units:

IBM Planning Analytics Tips & Tricks: Scatter vs Bubble

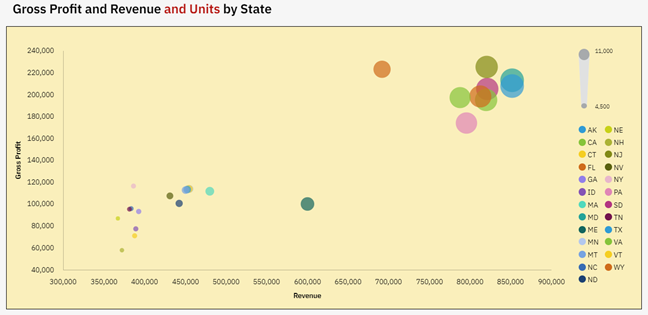
In both situations you can see the correlation in the data by looking at the patterns.  However, the bubble chart also gives you information on the units by adjusting the size of the dots.  This gives us another positive correlation between larger unit sales and larger revenue … thereby telling us that we may have the opportunity to introduce regional pricing.

As you can see, the type of chart makes a difference when reviewing your data. So how do you decide which chart to use? The simple answer is to ask yourself how many details do you want to see at once? Are you looking for two correlations or more? As long as your picture answers that question, you can never go wrong!

IBM Planning Analytics, powered by TM1, is full of new features and functionality. Need advice? Our team here at Revelwood can help. Contact us for more information at info@revelwood.com. We post new Planning Analytics Tips & Tricks weekly in our Knowledge Center and in newsletters.

Read more IBM Planning Analytics Tips & Tricks:

IBM Planning Analytics Tips & Tricks: Pie Chart Sizing

IBM Planning Analytics Tips & Tricks: The Waterfall Chart

IBM Planning Analytics Tips & Tricks: PAW Chart Padding

Author

  • Lee Lazarow

    View all posts
    • Categories

      • Accounting and Accounts Receivable
      • Awards & Recognition
      • Data Analytics in Finance
      • Financial Close & Consolidation
      • FP&A Done Right
      • IBM Planning Analytics Tips & Tricks
      • News & Events
      • Success Stories
      • Tech Bulletins
      • Workday Adaptive Planning Insights
      • Workday Adaptive Planning Tips & Tricks

    Popular Posts

    Authors

    Adam Riskin
    Adam Riskin
    Brian Colucci
    Brian Colucci
    Brian Combs
    Brian Combs
    Cameron Burke
    Cameron Burke
    Dave Miersch
    Dave Miersch
    Ivan Cepero
    Ivan Cepero
    John Pra Sisto
    John Pra Sisto
    Jonathan Dunn
    Jonathan Dunn
    Ken Wolf
    Ken Wolf
    Lee Lazarow
    Lee Lazarow
    Lisa Minneci
    Lisa Minneci
    Luke Griffie
    Luke Griffie
    Marc Assenza
    Marc Assenza
    Mary Luchs
    Mary Luchs
    Michael Mari
    Michael Mari
    Michelle Song
    Michelle Song
    Revelwood
    Revelwood
    Robert Nordhagen
    Robert Nordhagen
    Simon Foley
    Simon Foley
    Thomas McDade
    Thomas McDade

    Sign up for our newsletter

    Connect

Footer

Revelwood Overview

Revelwood helps finance organizations close, consolidate, plan, monitor and analyze business performance. As experts in solutions for the Office of Finance, we partner with best-in-breed software companies by applying best practices guidance and our pre-configured applications to help businesses achieve their full potential.

EXPERTISE

  • Workday Adaptive Planning
  • IBM Planning Analytics
  • BlackLine

ABOUT

  • Who We Are
  • What We Do
  • How We Help
  • How We Think
  • Privacy

CONNECT

World Headquarters

Florham Park, NJ | 201 984 3030

European Headquarters

London & Edinburgh | +44 (0)131 240 3866

Latin America Office

Miami, FL | 201 987 4198

Email
info@revelwood.com

Copyright © 2025 · Revelwood Inc. All rights reserved. Revelwood® and the Revelwood logo are registered marks of Revelwood Inc.