• Skip to main content
  • Skip to footer
Revelwood Logo

Revelwood

Your SUPER-powered WP Engine Site

  • Who We Are
    • About Us
      • Our Company
      • Our Team
      • Partners
    • Careers
      • Join Our Team
  • What We Do
    • Solutions
      • Workday Adaptive Planning
      • IBM Planning Analytics
      • BlackLine
    • Services
      • Implementation Services
      • Customer Care
        • Help Desk
        • System Administration as a Service
      • Training
        • Workday Adaptive Planning Training
        • IBM Planning Analytics / TM1 Training
    • Products
      • DataMaestro
      • LightSpeed
      • IBM Planning Analytics Utilities
  • How We Help
    • Use Cases
    • Client Success Stories
  • How We Think
    • Knowledge Center
    • Events
    • News
  • Contact Us

IBM Planning Analytics Tips & Tricks

IBM Planning Analytics Tips & Tricks: Stacked Rows in PAx


Tips & Tricks

March 8, 2022

By Lee Lazarow

Have you ever converted a stacked Perspectives view into a Dynamic report? If so, you may have noticed the way Excel formats the outside of your stack. For example, if I use the Active Form button to send the following view to Excel …

IBM Planning Analytics Tips & Tricks: Stacked Rows in PAx

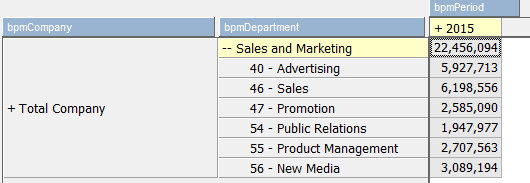
… then the result appears like this:

Stacked rows in IBM Planning Analytics for Excel (PAx)

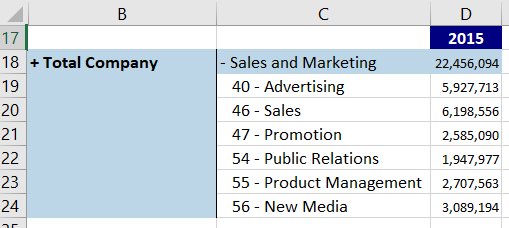
Perspectives groups the outside rows together via formatting. If I click on cell B19 then I will see that the cell contains the value “Total Company,” but the formatting makes the cell appear to be invisible.

But did you know that the same approach looks different in IBM Planning Analytics for Excel (PAx)? If I create a similar exploration in Planning Analytics for Excel and convert it to a dynamic report, then the result appears like this:

Working with stacked rows in Planning Analytics for Excel (PAx)

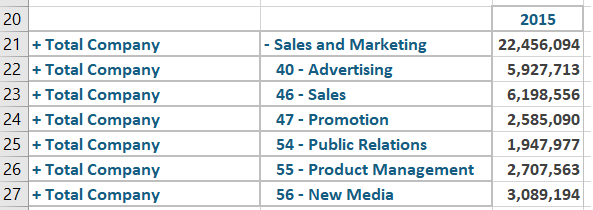
In Planning Analytics for Excel, a dynamic report with nested rows repeats the member names. The concept is the same and the data is the same, but the formatting is different.

So, is this good or is this bad? That’s up to you to decide. But if you decide that you prefer the Perspectives formatting, you can use conditional formatting combined with the OFFSET function to re-create the “invisible” approach.

IBM Planning Analytics, which TM1 is the engine for, is full of new features and functionality. Not sure where to start? Our team here at Revelwood can help. Contact us for more information at info@revelwood.com. And stay tuned for more Planning Analytics Tips & Tricks weekly in our Knowledge Center and in upcoming newsletters!

Read more IBM Planning Analytics Tips & Tricks:

IBM Planning Analytics Tips & Tricks: Excel OFFSET Function

IBM Planning Analytics Tips & Tricks: Alternative Row Formats for Excel Reports

IBM Planning Analytics Tips & Tricks: New PAx Feature

Author

  • Lee Lazarow

    View all posts
    • Categories

      • Accounting and Accounts Receivable
      • Awards & Recognition
      • Data Analytics in Finance
      • Financial Close & Consolidation
      • FP&A Done Right
      • IBM Planning Analytics Tips & Tricks
      • News & Events
      • Success Stories
      • Tech Bulletins
      • Workday Adaptive Planning Insights
      • Workday Adaptive Planning Tips & Tricks

    Popular Posts

    Authors

    Adam Riskin
    Adam Riskin
    Brian Colucci
    Brian Colucci
    Brian Combs
    Brian Combs
    Cameron Burke
    Cameron Burke
    Dave Miersch
    Dave Miersch
    Ivan Cepero
    Ivan Cepero
    John Pra Sisto
    John Pra Sisto
    Jonathan Dunn
    Jonathan Dunn
    Ken Wolf
    Ken Wolf
    Lee Lazarow
    Lee Lazarow
    Lisa Minneci
    Lisa Minneci
    Luke Griffie
    Luke Griffie
    Marc Assenza
    Marc Assenza
    Mary Luchs
    Mary Luchs
    Michael Mari
    Michael Mari
    Michelle Song
    Michelle Song
    Revelwood
    Revelwood
    Robert Nordhagen
    Robert Nordhagen
    Simon Foley
    Simon Foley
    Thomas McDade
    Thomas McDade

    Sign up for our newsletter

    Connect

Footer

Revelwood Overview

Revelwood helps finance organizations close, consolidate, plan, monitor and analyze business performance. As experts in solutions for the Office of Finance, we partner with best-in-breed software companies by applying best practices guidance and our pre-configured applications to help businesses achieve their full potential.

EXPERTISE

  • Workday Adaptive Planning
  • IBM Planning Analytics
  • BlackLine

ABOUT

  • Who We Are
  • What We Do
  • How We Help
  • How We Think
  • Privacy

CONNECT

World Headquarters

Florham Park, NJ | 201 984 3030

European Headquarters

London & Edinburgh | +44 (0)131 240 3866

Latin America Office

Miami, FL | 201 987 4198

Email
info@revelwood.com

Copyright © 2025 · Revelwood Inc. All rights reserved. Revelwood® and the Revelwood logo are registered marks of Revelwood Inc.