• Skip to main content
  • Skip to footer
Revelwood Logo

Revelwood

Your SUPER-powered WP Engine Site

  • Who We Are
    • About Us
      • Our Company
      • Our Team
      • Partners
    • Careers
      • Join Our Team
  • What We Do
    • Solutions
      • Workday Adaptive Planning
      • IBM Planning Analytics
      • BlackLine
    • Services
      • Implementation Services
      • Customer Care
        • Help Desk
        • System Administration as a Service
      • Training
        • Adaptive Planning Training
        • IBM Planning Analytics / TM1 Training
    • Products
      • DataMaestro
      • LightSpeed
      • IBM Planning Analytics Utilities
  • How We Help
    • Workday Adaptive Planning Use Cases
    • IBM Planning Analytics Use Cases
    • BlackLine Use Cases
    • Client Success Stories
  • How We Think
    • Knowledge Center
    • Events
    • News
  • Contact Us

IBM Planning Analytics Tips & Tricks

IBM Planning Analytics Tips & Tricks: Using Charts and Data Series with Dynamic Reports


March 15, 2022

By Thanh Chau

IBM Planning Analytics Workspace has several chart visualizations that you can use in place of Explorations. However, this functionality is not available in Planning Analytics for Excel (PAx). Excel has its own chart functionality, but it gets a bit tricky if we want to use it in conjunction with Dynamic Reports.

When a Dynamic Report is rebuilt, it deletes all rows below the first row in the report section and then copies and inserts the first row x times, with x corresponding to the number of rows in the TM1RPTVIEW. In an Excel chart, data series reference specific ranges in the sheet. When these ranges are deleted, the data series will return a #REF error.

Using Charts and Data Series with Dynamic Reports

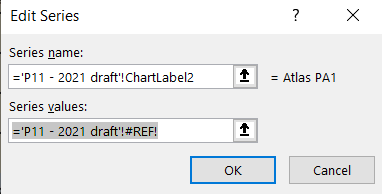
To save you the trouble of having to reassign the data series each time the dynamic report rebuilds, we will need the data series to dynamically determine where the referenced data is. Unfortunately, the data series will not accept any functions.  It only accepts references. To get around this, we would first need to create named ranges that use the Excel OFFSET function.

IBM Planning Analytics: Using Charts and Data Series with Dynamic Reports

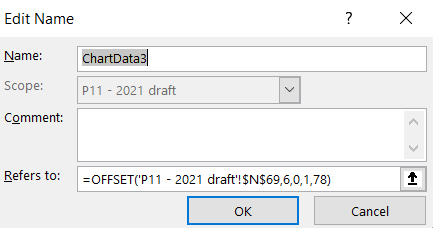
In the above example, we created a named range called ChartData3. It uses the OFFSET function to move the reference from cell N69 down 6 rows and span the range across 78 columns. Because row 69 is the first row of our dynamic report, it will never be deleted and cause a #REF error. 

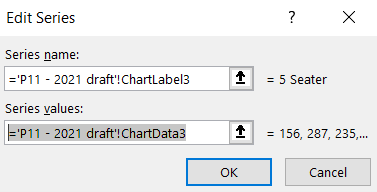
With the named range in place, we can now go back to the data series to reference it in the series values field.

IBM PAx - Using Charts and Data Series with Dynamic Reports

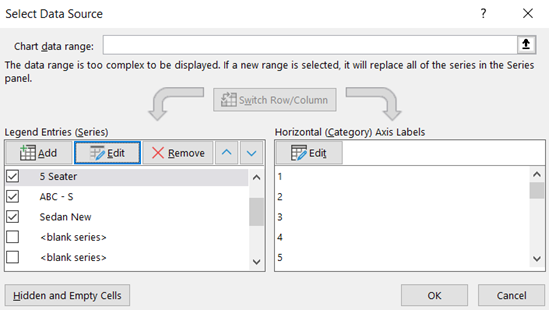
With dynamic reports, it’s possible for new rows to be added or rows removed depending on data that’s in the cube.  To plan for new rows in the dynamic report, we can establish a set number of data series in our chart. That way, when we do need the additional series, we can go into the “Select Data Source” chart section to enable the series that we need instead of recreating them. Conversely, we can also disable series that we don’t need when rows are removed.

Using Charts and Data Series with Dynamic Reports in IBM Planning Analytics for Excel (PAx)

IBM Planning Analytics, which TM1 is the engine for, is full of new features and functionality. Not sure where to start? Our team here at Revelwood can help. Contact us for more information at info@revelwood.com. And stay tuned for more Planning Analytics Tips & Tricks weekly in our Knowledge Center and in upcoming newsletters!

Read more IBM Planning Analytics Tips & Tricks posts:

IBM Planning Analytics Tips & Tricks: Excel OFFSET Function

IBM Planning Analytics Tips & Tricks: Fill Function

IBM Planning Analytics Tips & Tricks: Sparklines

Author

  • Thanh Chau
    Thanh Chau

    View all posts

    • Categories

      • Awards & Recognition
      • Financial Close & Consolidation
      • FP&A Done Right
      • IBM Planning Analytics Tips & Tricks
      • News & Events
      • Success Stories
      • Tech Bulletins
      • Workday Adaptive Planning Insights
      • Workday Adaptive Planning Tips & Tricks

    Popular Posts

    Authors

    Adam Riskin
    Adam Riskin
    Ailenette Cruz
    Ailenette Cruz
    Alex Goldman
    Alex Goldman
    Ben Alcock
    Ben Alcock
    Brian Combs
    Brian Combs
    Dave Miersch
    Dave Miersch
    Dillon Rossman
    Dillon Rossman
    Gary Leiffer
    Gary Leiffer
    John Pra Sisto
    John Pra Sisto
    Ken Wolf
    Ken Wolf
    Koury Reid
    Koury Reid
    Lee Lazarow
    Lee Lazarow
    Lisa Minneci
    Lisa Minneci
    Marc Assenza
    Marc Assenza
    Mary Luchs
    Mary Luchs
    Michelle Song
    Michelle Song
    Nina Inverso
    Nina Inverso
    Revelwood
    Revelwood
    Robert Nordhagen
    Robert Nordhagen
    Tara Byrnes
    Tara Byrnes
    Wesley DeMarco
    Wesley DeMarco

    Sign up for our newsletter

    Connect

Footer

Revelwood Overview

Revelwood helps finance organizations close, consolidate, plan, monitor and analyze business performance. As experts in solutions for the Office of Finance, we partner with best-in-breed software companies by applying best practices guidance and our pre-configured applications to help businesses achieve their full potential.

EXPERTISE

  • Workday Adaptive Planning
  • IBM Planning Analytics
  • BlackLine

ABOUT

  • Who We Are
  • What We Do
  • How We Help
  • How We Think
  • Privacy

CONNECT

Contact:

25B Vreeland Road, Suite 111 Florham Park, NJ 07932
201.984.3030
info@revelwood.com

Copyright © 2023 · Revelwood Inc. All rights reserved. Revelwood® and the Revelwood logo are registered marks of Revelwood Inc.