• Skip to main content
  • Skip to footer
Revelwood Logo

Revelwood

Your SUPER-powered WP Engine Site

  • Who We Are
    • About Us
      • Our Company
      • Our Team
      • Partners
    • Careers
      • Join Our Team
  • What We Do
    • Solutions
      • Workday Adaptive Planning
      • IBM Planning Analytics
      • BlackLine
    • Services
      • Implementation Services
      • Customer Care
        • Help Desk
        • System Administration as a Service
      • Training
        • Adaptive Planning Training
        • IBM Planning Analytics / TM1 Training
    • Products
      • DataMaestro
      • LightSpeed
      • IBM Planning Analytics Utilities
  • How We Help
    • Workday Adaptive Planning Use Cases
    • IBM Planning Analytics Use Cases
    • BlackLine Use Cases
    • Client Success Stories
  • How We Think
    • Knowledge Center
    • Events
    • News
  • Contact Us

IBM Planning Analytics Tips & Tricks

IBM Planning Analytics Tips & Tricks: Year-to-Date Hierarchies


Tips & Tricks

July 10, 2018

By Lee Lazarow

Did you know you can create a single hierarchy that contains all year-to-date values within an entire year?

As you know, TM1 is a consolidation tool which is designed to sum together a series of values.  There are many ways to create the consolidations using a combination of grand totals and sub totals.  This blog specifically addresses the year-to-date (YTD) hierarchy associated with a time dimension.

Many clients prefer to create a single hierarchy that contains all YTD values within an entire year.  The following image shows an example of this for a model that separates month and year as two separate dimensions:

Creating year to date hierarchies in TM1

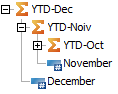
This approach allows users to drill into the values one month at a time to show both the previous YTD value and the value for the month.  But what happens if you want to see all of the details associated with YTD-Dec?  If a user wants to see each of the 12 months and the total then the user is required to drill 12 times and also see a series of subtotals along the way.

Instead of creating a single hierarchy, Revelwood recommends that a series of YTD calculations are created.  Each consolidated total consists of a single consolidated elements with a series of base level values below it.  The YTD totals are then consolidated into a grouping-consolidation called “Total YTD”.

For example, a group called “Total YTD” will contain children called Jan YTD, Feb YTD, etc.  Jan YTD will consist of one base level element (Jan) and Feb YTD will consist of two base level elements (Jan and Feb).  The “Total YTD” element will never be used for reporting since it serves solely as a grouping element, but the other various YTD elements will allow user to click once to see all of the details within the total.

Learn how to create year to date hierarchies in TM1

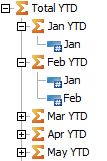
This approach shows the same subtotals as the initial approach while simplifying the drilling requirements.  As your users become more involved with ad-hoc analysis, they will appreciate the simplicity to dig into the details via a single click.

This method can also be expanded to use other time consolidations such as fiscal year (FY), ROY (rest of year) and TTM (trailing twelve months).

IBM Planning Analytics  is full of new features and functionality.  Not sure where to start?  Our team here at Revelwood can help. Contact us for more information at info@revelwood.com.  And stay tuned for more Planning Analytics Tips & Tricks weekly in our Knowledge Center and in upcoming newsletters!

Read more IBM Planning Analytics Tips & Tricks:

IBM Planning Analytics Tips & Tricks: GMT vs Local Time

IBM Planning Analytics Tips & Tricks: Captions

IBM Planning Analytics Tips & Tricks: Regions with Planning Analytics Rules

Author

  • Lee Lazarow
    Lee Lazarow

    View all posts

    • Categories

      • Awards & Recognition
      • Financial Close & Consolidation
      • FP&A Done Right
      • IBM Planning Analytics Tips & Tricks
      • News & Events
      • Success Stories
      • Tech Bulletins
      • Workday Adaptive Planning Insights
      • Workday Adaptive Planning Tips & Tricks

    Popular Posts

    Authors

    Adam Riskin
    Adam Riskin
    Ailenette Cruz
    Ailenette Cruz
    Alex Goldman
    Alex Goldman
    Ben Alcock
    Ben Alcock
    Brian Combs
    Brian Combs
    Dave Miersch
    Dave Miersch
    Dillon Rossman
    Dillon Rossman
    Gary Leiffer
    Gary Leiffer
    John Pra Sisto
    John Pra Sisto
    Ken Wolf
    Ken Wolf
    Koury Reid
    Koury Reid
    Lee Lazarow
    Lee Lazarow
    Lisa Minneci
    Lisa Minneci
    Marc Assenza
    Marc Assenza
    Mary Luchs
    Mary Luchs
    Michelle Song
    Michelle Song
    Nina Inverso
    Nina Inverso
    Revelwood
    Revelwood
    Robert Nordhagen
    Robert Nordhagen
    Tara Byrnes
    Tara Byrnes
    Wesley DeMarco
    Wesley DeMarco

    Sign up for our newsletter

    Connect

Footer

Revelwood Overview

Revelwood helps finance organizations close, consolidate, plan, monitor and analyze business performance. As experts in solutions for the Office of Finance, we partner with best-in-breed software companies by applying best practices guidance and our pre-configured applications to help businesses achieve their full potential.

EXPERTISE

  • Workday Adaptive Planning
  • IBM Planning Analytics
  • BlackLine

ABOUT

  • Who We Are
  • What We Do
  • How We Help
  • How We Think
  • Privacy

CONNECT

Contact:

25B Vreeland Road, Suite 111 Florham Park, NJ 07932
201.984.3030
info@revelwood.com

Copyright © 2023 · Revelwood Inc. All rights reserved. Revelwood® and the Revelwood logo are registered marks of Revelwood Inc.