• Skip to main content
  • Skip to footer
Revelwood Logo

Revelwood

Your SUPER-powered WP Engine Site

  • Who We Are
    • About Us
      • Our Company
      • Our Team
      • Partners
    • Careers
      • Join Our Team
  • What We Do
    • Solutions
      • Workday Adaptive Planning
      • IBM Planning Analytics
      • BlackLine
    • Services
      • Implementation Services
      • Customer Care
        • Help Desk
        • System Administration as a Service
      • Training
        • Workday Adaptive Planning Training
        • IBM Planning Analytics / TM1 Training
    • Products
      • DataMaestro
      • LightSpeed
      • IBM Planning Analytics Utilities
  • How We Help
    • Use Cases
    • Client Success Stories
  • How We Think
    • Knowledge Center
    • Events
    • News
  • Contact Us

IBM Planning Analytics Tips & Tricks

IBM Planning Tips & Tricks: Asymmetrical Axis in PAx


Tips & Tricks

February 6, 2018

By Revelwood

This is a guest blog post by Revelwood’s Nicole Frigo.

Did you know that IBM Planning Analytics for Excel (PAx) gives you the ability to use an asymmetrical approach that allows you to display combinations of elements without the repetition? IBM Cognos TM1 and IBM Planning Analytics gives you the ability to quickly create views of your existing data.  The views are symmetrical, which means that any rows or columns that contain multiple elements will include all possible combinations of the selected elements.  But sometimes you may not want to see all combinations.

The following is an example of a symmetrical view that will be converted into an asymmetrical view.  This example will use a Financial GL cube.

Connect to an environment in PAx and created an exploration. We will arrange our view in the following way:

  • Accounts will be on the rows.
  • Scenario and Period will be on the columns (using multiple periods and a single scenario)
  • All other dimensions will be in the context area.

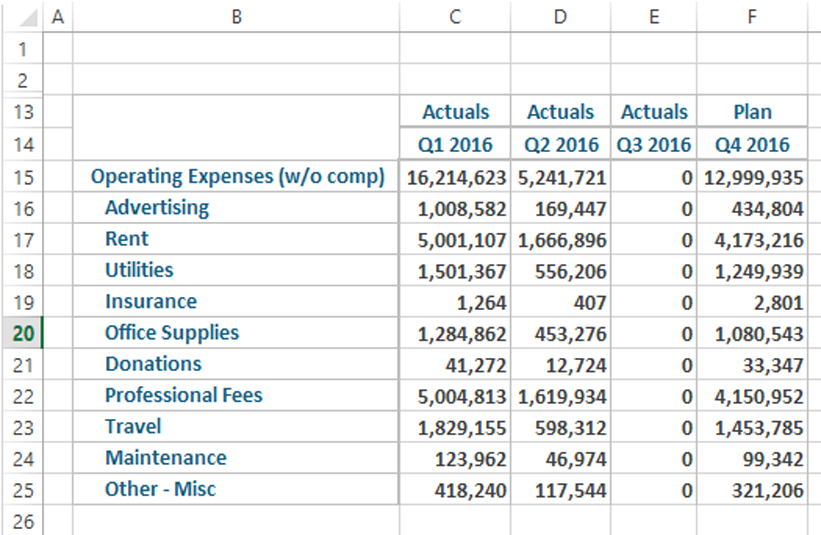
Here are the results of our example:

IBM Planning Analytics for Excel (PAx)

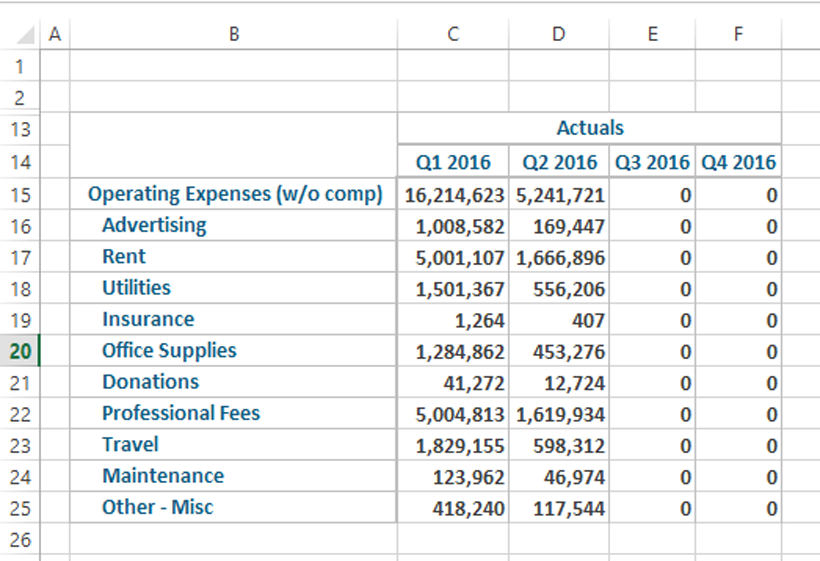
It may not make sense to show Actuals for all 4 quarters since there are no actuals for Q3 or Q4.  It may make more sense to show Plan values in those months.  A symmetrical view would require 8 columns to appear (4 Actuals plus 4 Plan), but an asymmetrical view allows the columns to be merged together.

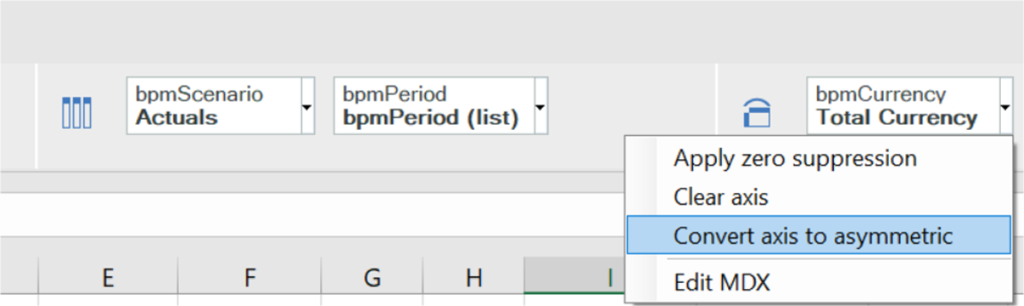
Right click in the column drop zone area and select the option to “Convert Axis to asymmetric”.

Asymmetrical axis in IBM PAx

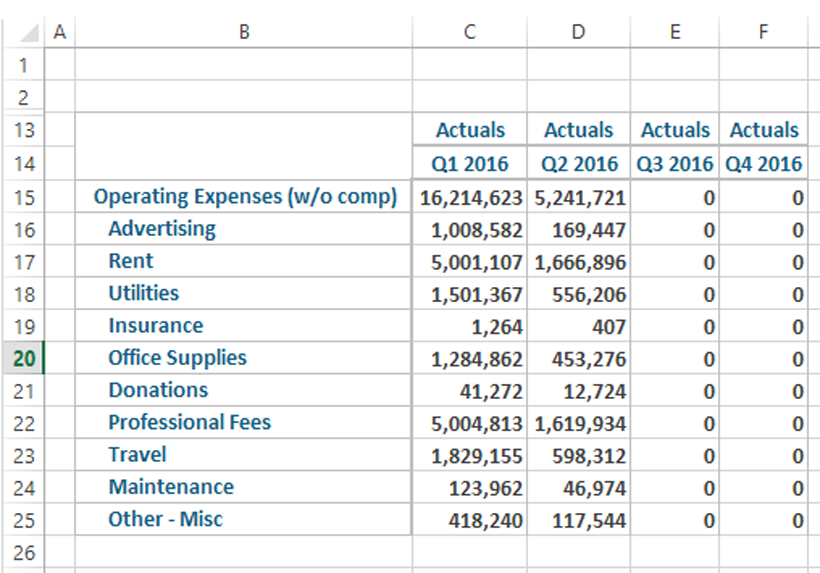
Once converted, you will see that each column now has its own scenario header, each of which now shows Actuals (which was the value of the original exploration).

Asymmetrical Axis in IBM Planning Analytics for Excel

Expand the scenario dimension in the navigation tree to display all of the members.

Navigation tree in IBM Planning Analytics for Excel

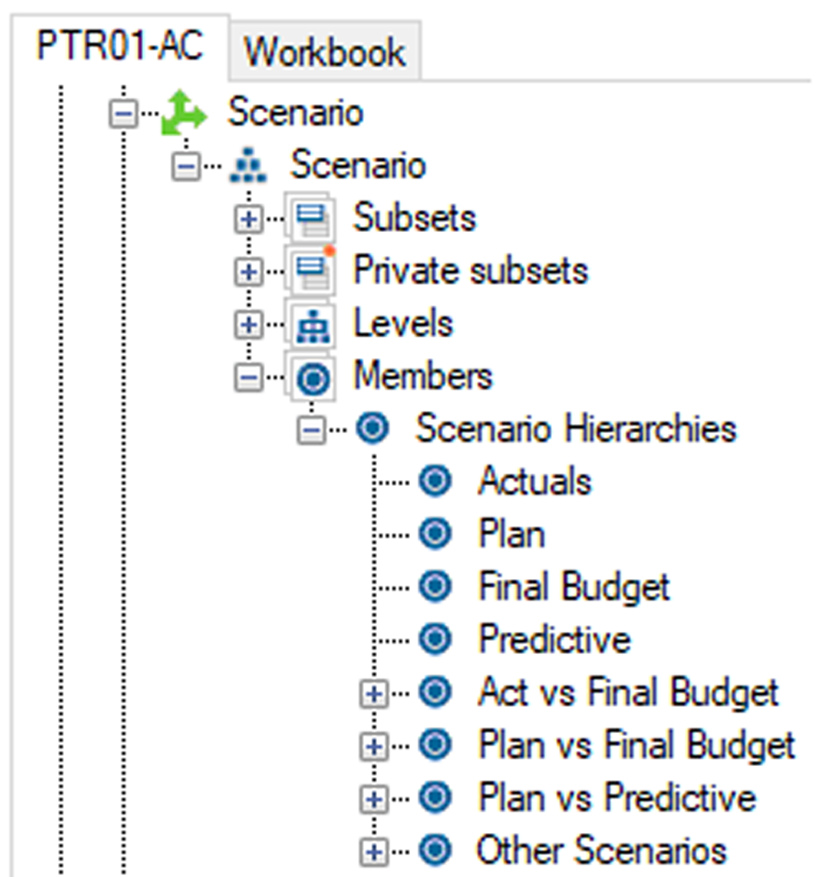
Select the Plan element and drag this onto the cell for Actuals of Q4 (cell F13 in this example). Release the cursor when you see an outline around the cell.  You will notice that Q4 is now showing the Plan values while the prior 3 quarters are still showing Actuals.

Plan element in IBM Planning Analytics for Excel

A stacked square icon appears in the left corner of any axis where asymmetry is applied.

PAx stacked square icon

You can convert the exploration back to a symmetrical version by double clicking on the icon.

Asymmetric analyses are one of many new features in PAx that enhance the overall functionality and reporting capabilities of Planning Analytics.

IBM Planning Analytics, which TM1 is the engine for,  is full of new features and functionality. Not sure where to start?  Our team here at Revelwood can help.  Contact us for more information at info@revelwood.com.  And stay tuned for more Planning Analytics Tips & Tricks weekly in our Knowledge Center and in upcoming newsletters!

Author

  • Revelwood

    View all posts
    • Categories

      • Accounting and Accounts Receivable
      • Awards & Recognition
      • Data Analytics in Finance
      • Financial Close & Consolidation
      • FP&A Done Right
      • IBM Planning Analytics Tips & Tricks
      • News & Events
      • Success Stories
      • Tech Bulletins
      • Workday Adaptive Planning Insights
      • Workday Adaptive Planning Tips & Tricks

    Popular Posts

    Authors

    Adam Riskin
    Adam Riskin
    Brian Colucci
    Brian Colucci
    Brian Combs
    Brian Combs
    Cameron Burke
    Cameron Burke
    Dave Miersch
    Dave Miersch
    Ivan Cepero
    Ivan Cepero
    John Pra Sisto
    John Pra Sisto
    Jonathan Dunn
    Jonathan Dunn
    Ken Wolf
    Ken Wolf
    Lee Lazarow
    Lee Lazarow
    Lisa Minneci
    Lisa Minneci
    Luke Griffie
    Luke Griffie
    Marc Assenza
    Marc Assenza
    Mary Luchs
    Mary Luchs
    Michael Mari
    Michael Mari
    Michelle Song
    Michelle Song
    Revelwood
    Revelwood
    Robert Nordhagen
    Robert Nordhagen
    Simon Foley
    Simon Foley
    Thomas McDade
    Thomas McDade

    Sign up for our newsletter

    Connect

Footer

Revelwood Overview

Revelwood helps finance organizations close, consolidate, plan, monitor and analyze business performance. As experts in solutions for the Office of Finance, we partner with best-in-breed software companies by applying best practices guidance and our pre-configured applications to help businesses achieve their full potential.

EXPERTISE

  • Workday Adaptive Planning
  • IBM Planning Analytics
  • BlackLine

ABOUT

  • Who We Are
  • What We Do
  • How We Help
  • How We Think
  • Privacy

CONNECT

World Headquarters

Florham Park, NJ | 201 984 3030

European Headquarters

London & Edinburgh | +44 (0)131 240 3866

Latin America Office

Miami, FL | 201 987 4198

Email
info@revelwood.com

Copyright © 2025 · Revelwood Inc. All rights reserved. Revelwood® and the Revelwood logo are registered marks of Revelwood Inc.