Have you ever been in a situation where you have a long TI script and need to change a few lines. You plan out the steps, make the first change, get ready for the second, and then hear the phone ring. After a brief conversion, you get back to coding … only to realize that you forgot where you left off. Situations like this could cause redundant, or even erroneous, code.
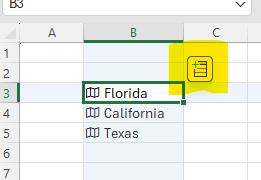
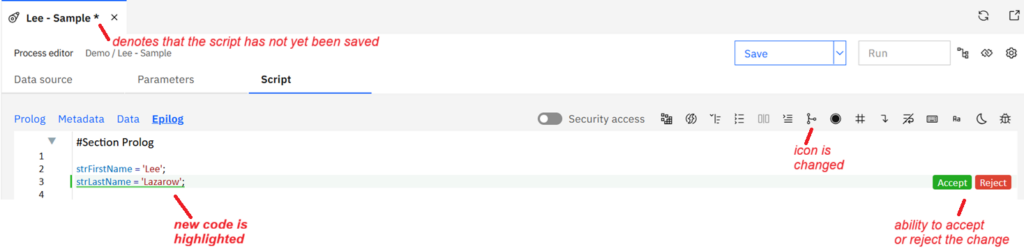
As of PAW version 2.1.18, you can review changes that have been made to your script by highlighting the differences between the current saved version of the script and your unsaved edits. This is done by using the “Diff View” icon within the process editor.

Once clicked, the screen will change in two ways:
- 1. It will show the new code and prompt you to Accept or Reject the new code
- 2. It will change the icon associated with the Diff View feature
In the example below, line 2 is part of the original (saved) script and line 3 has been added:
The Diff View feature must be configured by the system administrators. This is enabled or disabled within Administration > Features.
This approach will help you stay organized in situations where you are unable to perform all of your coding in one interrupted session.
Revelwood is an IBM Gold Business Partner with more than 30 years of experience designing, developing, implementing and maintaining IBM Planning Analytics environments. We focus on solutions for the Office of Finance and have partnered with clients of all sizes across all industries to optimize, enhance and expand their use of Planning Analytics. Revelwood’s Planning Analytics team consists of PA experts with decades of experience, and we have been recognized via awards including IBM Champion status.
Stay up to date with PA – sign up for our weekly Planning Analytics Tips & Tricks newsletter, subscribe to our YouTube channel, and join our IBM Planning Analytics All-Stars group on LinkedIn.
Read more IBM Planning Analytics Tips & Tricks:
How to Handle Outliers in IBM Planning Analytics Predictive Modeling
Celebrating Pi Day with Excel’s =PI() Function
Use the Planning Analytics AI Assistant for Smarter Data Analysis