When Planning Analytics for Excel (PAfE) connects to your TM1 server, it’s constantly working behind the scenes — making API calls to retrieve data, refresh reports, and keep your models in sync. Most of the time, this happens without a hitch. But when something goes wrong, knowing where to look can save you a significant amount of troubleshooting time.
PAfE logs every error it encounters to a folder on the user’s local machine. These log files capture details about failed API calls, connection issues, and other errors that may not surface clearly in the application itself. Whether you’re a developer trying to debug a report or an admin supporting end users, the log folder is one of the first places you should check.
How to Access the Log Folder
There are two ways to get there.
Option 1: Through the PAfE Interface
Step 1: Click the Options icon in the PAfE ribbon.
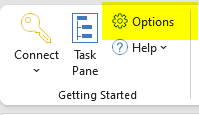
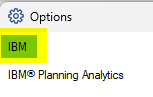
Step 2: Click the IBM button in the left-hand pane.
Step 3: Click the View Logs button.

PAfE will open Windows Explorer and navigate directly to the log folder — no manual digging required.
Option 2: Navigate Directly
If PAfE isn’t opening, or you need to access the logs on behalf of another user, you can navigate to the folder manually:
C:\Users\[User Name]\AppData\Local\Cognos\Office Connection\Logs
Note that the AppData folder is hidden by default in Windows. If you can’t see it, make sure hidden items are visible in Windows Explorer (View → Show → Hidden items).
What You’ll Find There
Inside the log folder, you’ll see a collection of files typically named by date or session. Opening them in any text editor (Notepad works fine) will show you a timestamped record of API calls and any errors that occurred. Key things to look for include:
- – HTTP error codes: a 401 points to an authentication issue; a 404 may indicate a cube or view that no longer exists
- – Connection timeouts: often a sign of network latency or a TM1 server under heavy load
- – Object not found errors: useful for catching broken references in reports after a model restructure
Keeping the Folder Clean
Log files accumulate over time and can take up more disk space than users expect, especially in environments where PAfE is used heavily. There’s no automated cleanup built into PAfE, so it’s worth reminding users to periodically delete old logs — or including it as part of your standard workstation maintenance routine. You can safely delete any log files from sessions that have already been reviewed or are no longer relevant.
Revelwood is an IBM Gold Business Partner with more than 30 years of experience designing, developing, implementing and maintaining IBM Planning Analytics environments. We focus on solutions for the Office of Finance and have partnered with clients of all sizes across all industries to optimize, enhance and expand their use of Planning Analytics. Revelwood’s Planning Analytics team consists of PA experts with decades of experience, and we have been recognized via awards including IBM Champion status.
Stay up to date with PA – sign up for our weekly Planning Analytics Tips & Tricks newsletter, subscribe to our YouTube channel, and join our IBM Planning Analytics All-Stars group on LinkedIn.
Read more IBM Planning Analytics Tips & Tricks:
Goodbye Excel Groupings, Hello Toggle Buttons: A PAfE Win for Web Reports
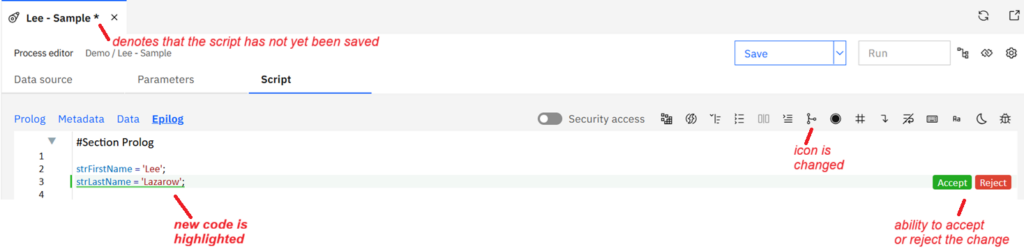
How to Use Diff View in IBM Planning Analytics Workspace to Track TI Script Changes
How to Handle Outliers in IBM Planning Analytics Predictive Modeling