Cube sheets in Workday Adaptive Planning often include a wide range of filters such as dimensions, accounts, attributes, and others. However, not all options under each filter are relevant for every model. By taking advantage of the cube sheet restrictions feature in Workday Adaptive Planning, you can hide or limit unnecessary filters, simplifying the sheet and improving usability.
The restrictions function offers powerful customization options. Users can configure a sheet to display different accounts for the actuals version versus the forecast version, specify accounts tied to specific dimension values, filter accounts to appear at different levels, and more. This flexibility helps tailor cube sheets to your needs while keeping them efficient.
It’s important to note that cube sheets have a 15,000-row limit. Using restrictions to limit intersections on the sheet prevents unnecessary rows, ensuring optimal performance and maintaining clarity in your data.
How To Add Cube Sheet Restrictions
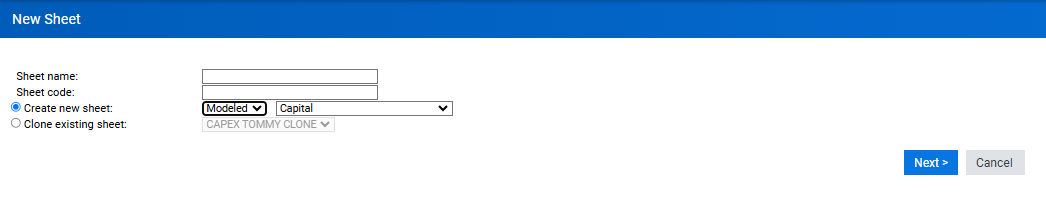
1. Go to Modeling -> Level assigned or user assigned sheets -> Select the cube sheet you want to add restrictions to.

2. Click Restrictions

3. Click Add New
There are two elements of a cube sheet restriction. The first is selecting what dimension determines what you want to restrict and the second is what dimension will be restricted.

In this example, if you create a Level/Site-Dimension restriction, you can specify which sites to be able to select for any given set of levels.

Here, I am checking off just Sites 1, 2, and 3 to be shown for the Operations level.

For the Marketing level, I want sites 4, 5, and 6 to show, but not 1-3 or 7-9. Click the save icon in the top left corner.

Now, when I filter this cube sheet by the Operations level, only sites 1-3 are available to select from the dropdown. When I go to the Marketing level, only sites 4-6 are available.

Revelwood is an award-winning, Platinum Solution Provider for Workday Adaptive Planning. We build solutions for the Office of Finance that minimize your risk by seamlessly incorporating business analytics into your everyday thinking. By combining the software with our best practices and out-of-the-box applications, we help businesses achieve their full potential with Workday Adaptive Planning.
Read more Workday Adaptive Planning Tips & Tricks:
Workday Adaptive Planning Tips & Tricks: The User Access Calculator
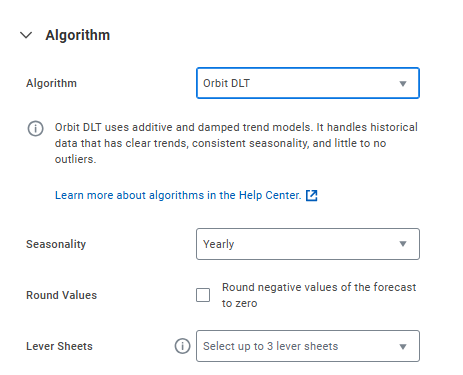
Workday Adaptive Planning Tips & Tricks: Machine Learning Predictive Forecaster: Lever Sheets