• Skip to main content
  • Skip to footer
Revelwood Logo

Revelwood

Your SUPER-powered WP Engine Site

  • Who We Are
    • About Us
      • Our Company
      • Our Team
      • Partners
    • Careers
      • Join Our Team
  • What We Do
    • Solutions
      • Workday Adaptive Planning
      • IBM Planning Analytics
      • BlackLine
    • Services
      • Implementation Services
      • Customer Care
        • Help Desk
        • System Administration as a Service
      • Training
        • Workday Adaptive Planning Training
        • IBM Planning Analytics / TM1 Training
    • Products
      • DataMaestro
      • LightSpeed
      • IBM Planning Analytics Utilities
  • How We Help
    • Use Cases
    • Client Success Stories
  • How We Think
    • Knowledge Center
    • Events
    • News
  • Contact Us

IBM Planning Analytics Tips & Tricks

IBM Planning Analytics Tips & Tricks: Adding Images to Charts


September 12, 2023

By Ivan Cepero

Charts are an excellent way to use visuals to convey information. Did you know that you can increase the effect of charts in Excel by adding custom images?

Consider this plain pie chart.

Chart, pie chart

Description automatically generated

We can insert a corporate logo to give the chart a greater visual appeal and branding.

1 – Click on the chart to select it

2 – Right click and select “Format Chart Area”

3 – Select “Picture or texture fill”

A screenshot of a phone

Description automatically generated with medium confidence

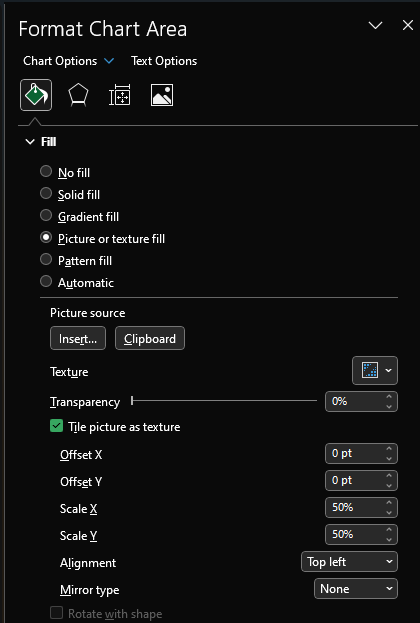
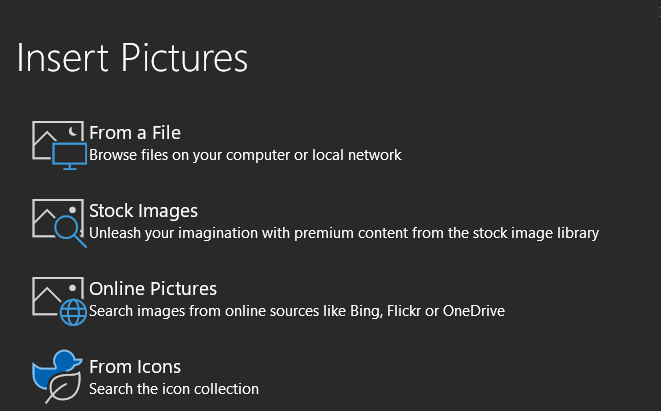
4 – Select “Insert” to insert an image from your computer or “Clipboard” to insert a previously copied image

When clicking “Insert” you will see a pop up letting you pick various image sources.

Text

Description automatically generated

5 – You can further refine the options by having the image tile, offset or scale.

Here is the updated chart with the Revelwood logo applied, tiled and set with transparency level 80%:

Chart, pie chart

Description automatically generated

You can also apply custom images to a specific data point (e.g. a pie slice in this example) by initially selecting the data point instead of the entire chart, then following the steps outlined above.

IBM Planning Analytics, which TM1 is the engine for, is full of new features and functionality. Not sure where to start? Our team here at Revelwood can help. Contact us for more information at info@revelwood.com. And stay tuned for more Planning Analytics Tips & Tricks weekly in our Knowledge Center and in upcoming newsletters!

Read more IBM Planning Analytics Tips & Tricks:

IBM Planning Analytics Tips & Tricks: Popular Video Tips, Part 3

IBM Planning Analytics Tips & Tricks: Counting Hidden Rows in Excel

IBM Planning Analytics Tips & Tricks: Popular Video Tips, Part 2

Author

  • Ivan Cepero

    View all posts
    • Categories

      • Accounting and Accounts Receivable
      • Awards & Recognition
      • Data Analytics in Finance
      • Financial Close & Consolidation
      • FP&A Done Right
      • IBM Planning Analytics Tips & Tricks
      • News & Events
      • Success Stories
      • Tech Bulletins
      • Workday Adaptive Planning Insights
      • Workday Adaptive Planning Tips & Tricks

    Popular Posts

    Authors

    Adam Riskin
    Adam Riskin
    Brian Colucci
    Brian Colucci
    Brian Combs
    Brian Combs
    Cameron Burke
    Cameron Burke
    Dave Miersch
    Dave Miersch
    Ivan Cepero
    Ivan Cepero
    John Pra Sisto
    John Pra Sisto
    Jonathan Dunn
    Jonathan Dunn
    Ken Wolf
    Ken Wolf
    Lee Lazarow
    Lee Lazarow
    Lisa Minneci
    Lisa Minneci
    Luke Griffie
    Luke Griffie
    Marc Assenza
    Marc Assenza
    Mary Luchs
    Mary Luchs
    Michael Mari
    Michael Mari
    Michelle Song
    Michelle Song
    Revelwood
    Revelwood
    Robert Nordhagen
    Robert Nordhagen
    Simon Foley
    Simon Foley
    Thomas McDade
    Thomas McDade

    Sign up for our newsletter

    Connect

Footer

Revelwood Overview

Revelwood helps finance organizations close, consolidate, plan, monitor and analyze business performance. As experts in solutions for the Office of Finance, we partner with best-in-breed software companies by applying best practices guidance and our pre-configured applications to help businesses achieve their full potential.

EXPERTISE

  • Workday Adaptive Planning
  • IBM Planning Analytics
  • BlackLine

ABOUT

  • Who We Are
  • What We Do
  • How We Help
  • How We Think
  • Privacy

CONNECT

World Headquarters

Florham Park, NJ | 201 984 3030

European Headquarters

London & Edinburgh | +44 (0)131 240 3866

Latin America Office

Miami, FL | 201 987 4198

Email
info@revelwood.com

Copyright © 2025 · Revelwood Inc. All rights reserved. Revelwood® and the Revelwood logo are registered marks of Revelwood Inc.