Did you know it’s easy to create a simple dashboard in IBM Planning Analytics Workspace? IBM Planning Analytics Workspace dashboards allow you to provide quick and effective information to the end user. The following steps demonstrate how to create a simple dashboard.
- Navigate to your instance of Planning Analytics Workspace (PAW). Select New > Book from template.
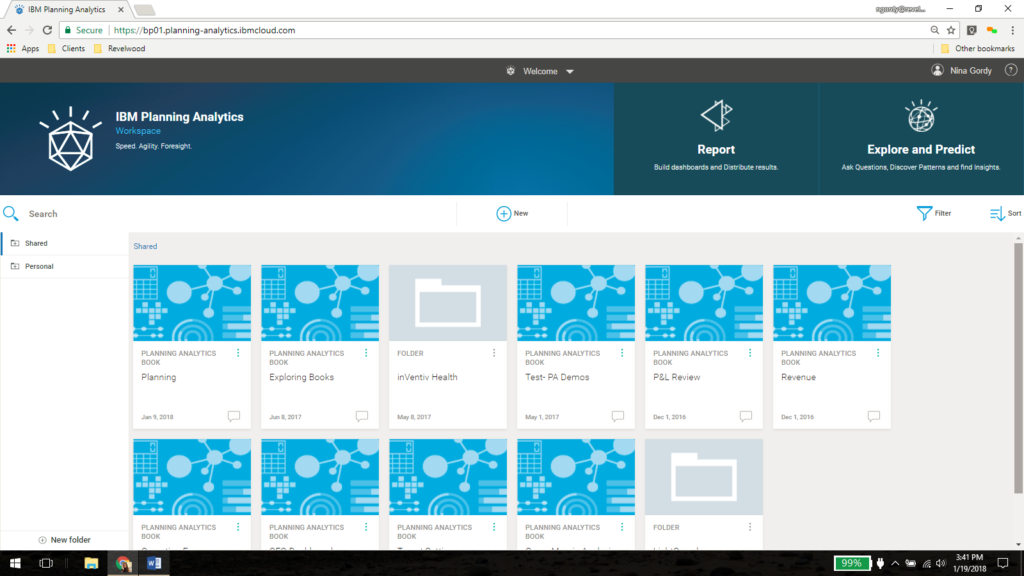
- Note: By selecting New > Book, PAW will automatically open a new tabbed workbook. The single page option is only available when you select New > Book from template.
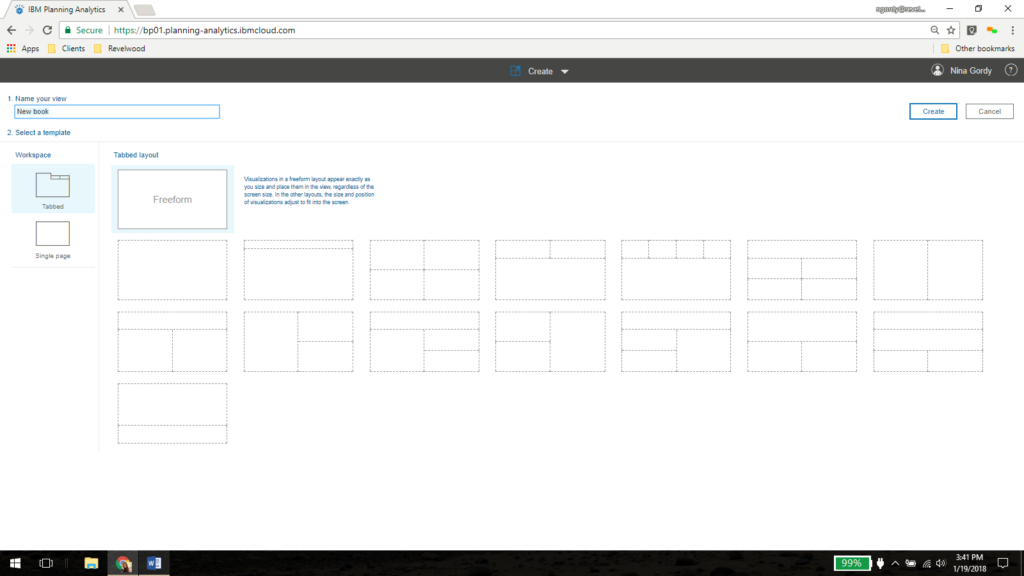
- Name your view, select Tabbed and Freeform, and click Create to create a new tabbed workbook.
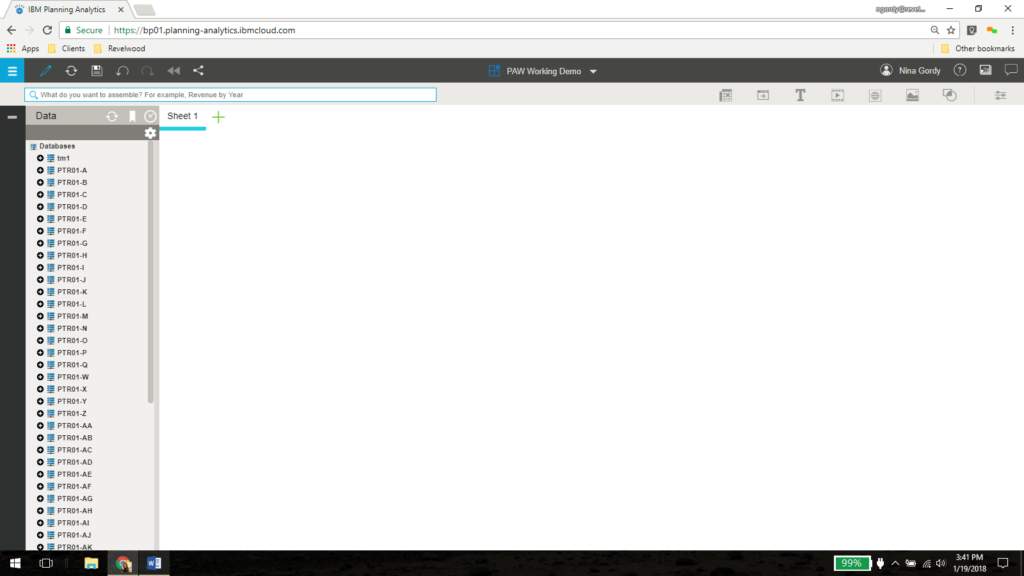
- Expand your TM1 service in the list of available TM1 services in the navigation pane. Then expand Cubes, expand a cube from your list, and expand Views. Drag and drop a saved view onto Sheet 1, and position it on the left-hand side of the screen.
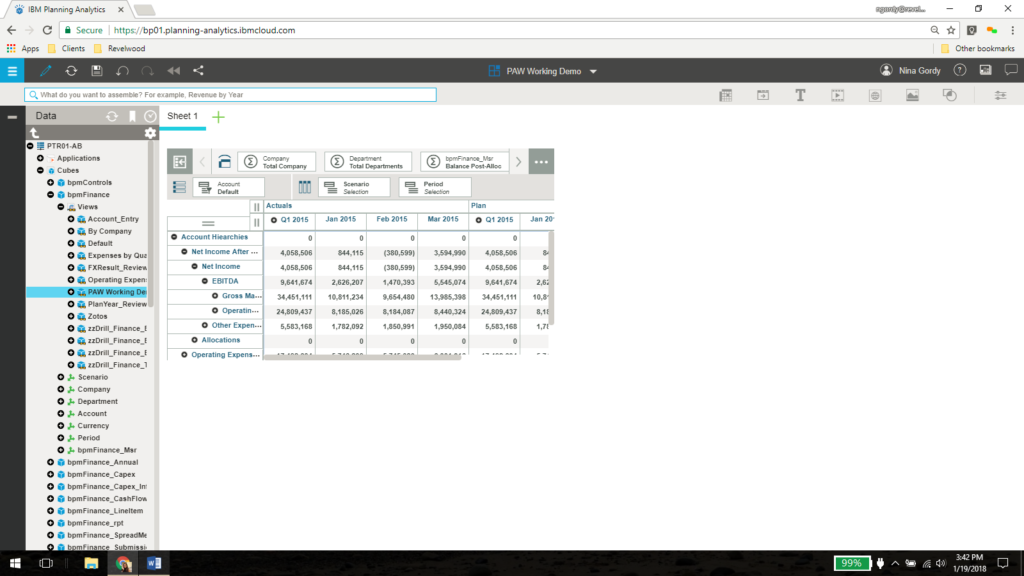
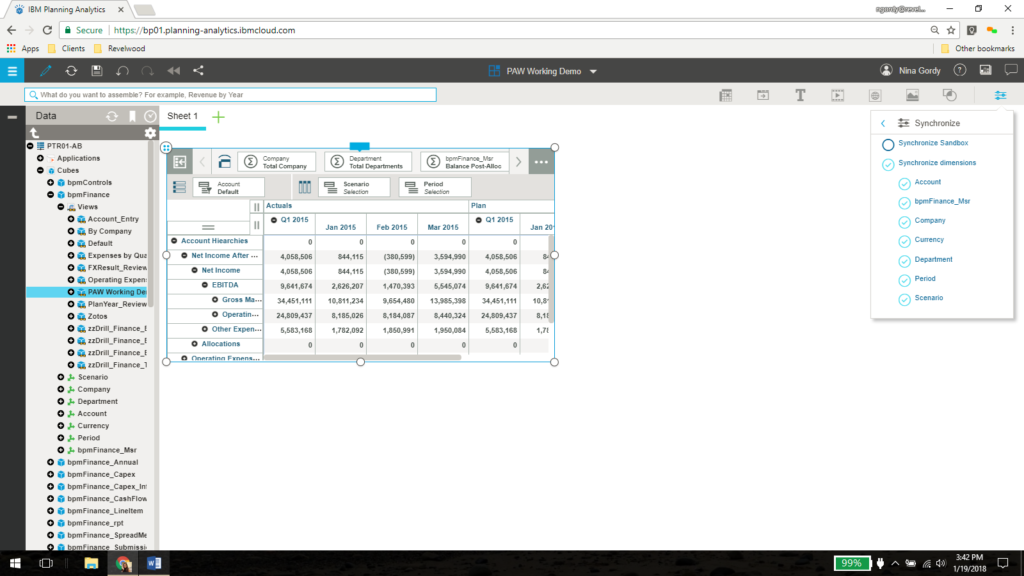
- Click on the exploration to activate it. Then click on the Properties button in the upper right-hand corner of the screen. From here, select Synchronize > Synchronize dimensions. This will keep the exploration in sync with the rest of Sheet 1.
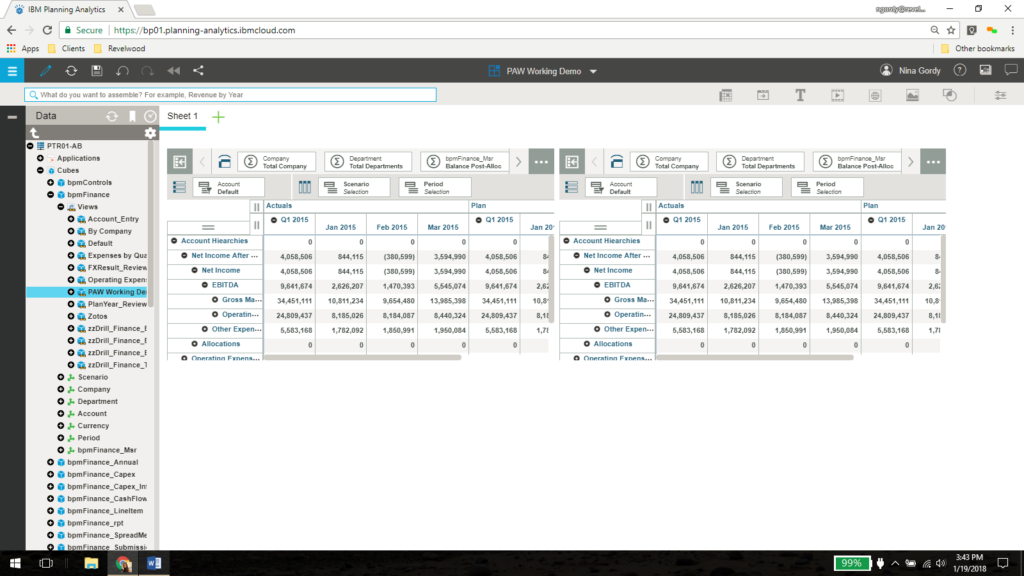
- Click on the exploration to activate it. Then display the options by clicking on the blue rectangular button located in the top, center portion of the exploration. Select the Duplicate option, which is fifth from the right.
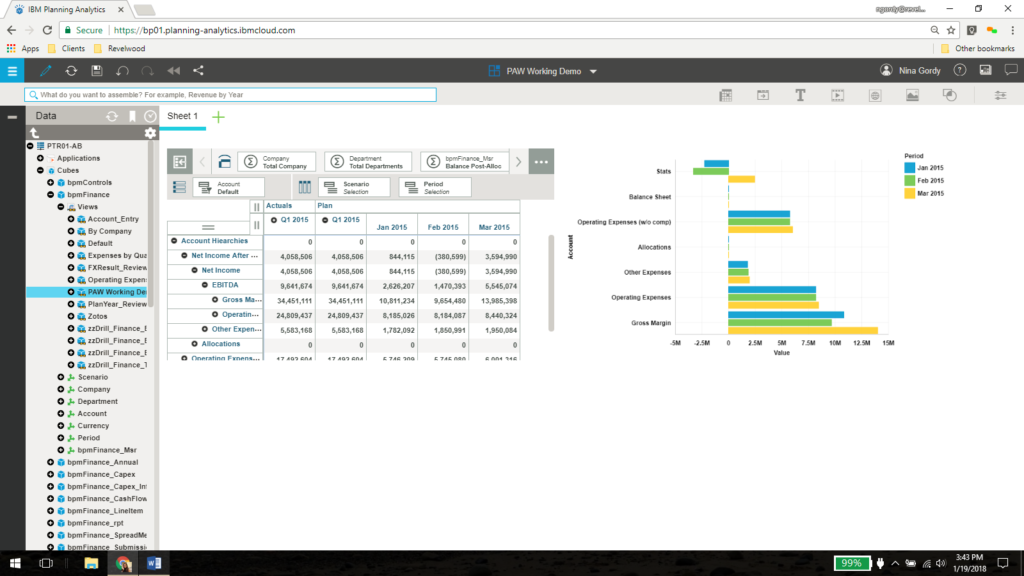
- Drag and drop dimensions to/from the context, row, and column sections to change the data shown in the explorations. Display the options and select the Change visualization option, which is second from the right. Select Bar to display the data as a bar chart. Display the options again and click the Show/hide overview button all the way on the right to complete the dashboard.
You can add other objects, explorations, and customizations to create unique dashboards. For more information on Planning Analytics Workspace, refer to the IBM Planning Analytics 2.0.0 documentation.
IBM Planning Analytics is full of new features and functionality. Not sure where to start? Our team here at Revelwood can help. Contact us for more information at info@revelwood.com. And stay tuned for more Planning Analytics Tips & Tricks weekly in our Knowledge Center and in upcoming newsletters!
Read more blog posts with IBM Planning Analytics Tips & Tricks:
IBM Planning Analytics Tips & Tricks: Creating Dynamic, Attractive Views and Dashboards
IBM Planning Analytics Tips & Tricks: Planning Analytics Workspace Chart Types
IBM Planning Analytics Tips & Tricks: The Data Hold Feature in Planning Analytics Workspace

