Have you ever been in a situation where you saved a view and then realized that you want to change the name in IBM Planning Analytics for Excel (PAfE, formerly PAx)? Maybe you had a typo or maybe you referenced a date that has changed.
In the old Perspectives world, there was no way to change the name of an existing view, so you were forced to resave the view with a new name and then delete the original view. Planning Analytics for Excel offers the ability to rename a view without having to perform multiple steps.
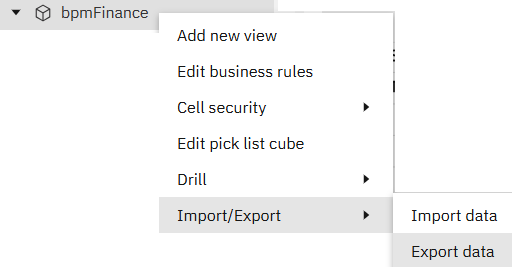
Renaming a view in PAfE is as simple as right-clicking on the view!

Once the option is selected, a popup box will appear that allows you to rename the view.
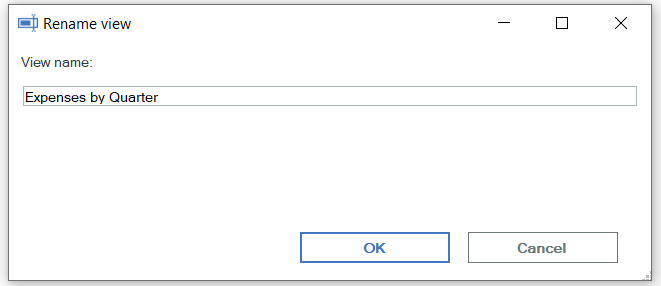
This approach gives you the ability to maintain your environment with a single click, thereby simplifying your overall processes.

Revelwood is an IBM Gold Business Partner with 25+ years of experience designing, developing, implementing and maintaining IBM Planning Analytics environments. Revelwood has helped clients in all sizes across all industries optimize and grow their use of Planning Analytics. Revelwood’s Planning Analytics team consists of experienced PA experts, including a multi-year IBM Champion.
Stay up to date with PA – sign up for our weekly Planning Analytics Tips & Tricks newsletter, subscribe to our YouTube channel, and join our IBM Planning Analytics All-Stars group on LinkedIn.
Read more IBM Planning Analytics Tips & Tricks:
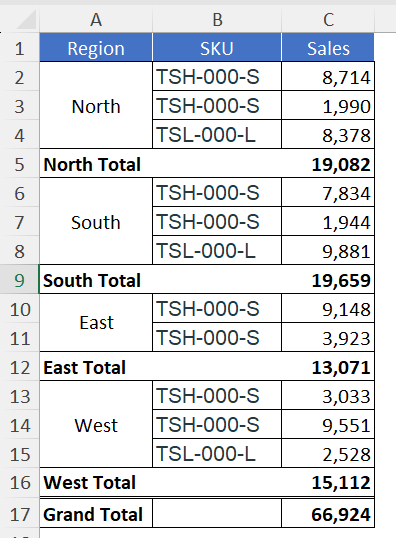
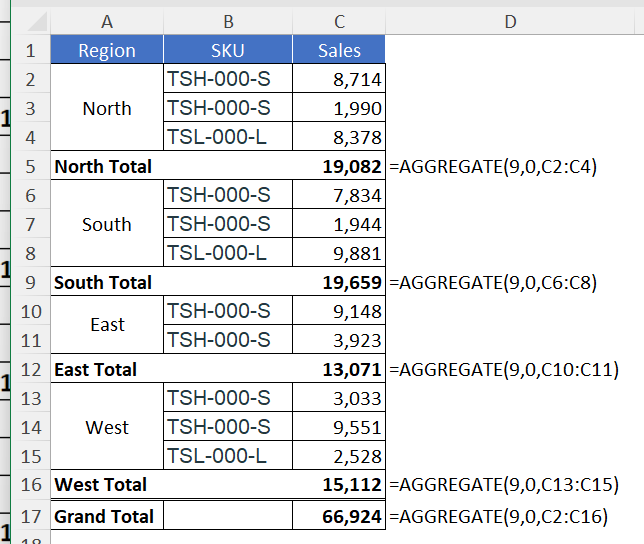
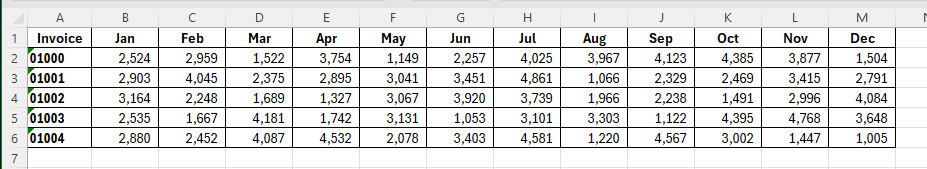
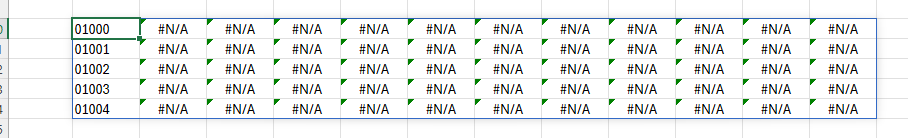
IBM Planning Analytics Tips & Tricks: Excel’s AGGREGATE Function
IBM Planning Analytics Tips & Tricks: Update on Planning Analytics’ Deprecation