• Skip to main content
  • Skip to footer
Revelwood Logo

Revelwood

Your SUPER-powered WP Engine Site

  • Who We Are
    • About Us
      • Our Company
      • Our Team
      • Partners
    • Careers
      • Join Our Team
  • What We Do
    • Solutions
      • Workday Adaptive Planning
      • IBM Planning Analytics
      • BlackLine
    • Services
      • Implementation Services
      • Customer Care
        • Help Desk
        • System Administration as a Service
      • Training
        • Adaptive Planning Training
        • IBM Planning Analytics / TM1 Training
    • Products
      • DataMaestro
      • LightSpeed
      • IBM Planning Analytics Utilities
  • How We Help
    • Workday Adaptive Planning Use Cases
    • IBM Planning Analytics Use Cases
    • BlackLine Use Cases
    • Client Success Stories
  • How We Think
    • Knowledge Center
    • Events
    • News
  • Contact Us

Workday Adaptive Planning Tips & Tricks

Workday Adaptive Planning Tips & Tricks: Crosstabs – The Significance of and How to Build


October 12, 2022

By Alex Goldman

Crosstabs in Workday Adaptive Planning are a great way to visualize and analyze data. This type of chart is great for comparing data sets and their relationships. Data in a Crosstab is visualized in a tabular format. Crosstab allows you to compare change over time, based on one or more accounts. Crosstabs also allow you to add different dimensions to view variances throughout the company. For example, a Crosstab can display a company’s revenue and net profit from different years, as well as filter by office or location.

How to Build a Crosstab

There are a few rules to follow in order to successfully build a Crosstab. At least one Account is needed to be selected to build a Crosstab. While Time is typically used in Crosstabs, it is not required when making the visualization. The Time Dimension will allow you to compare data results from previous time periods, which can allow businesses to analyze whether they are going in the right direction. Here is a step-by-step development of a Crosstab to view Expenses for a company on a quarterly basis and by Supervisor Organization (Operations, Corporate, or Other).

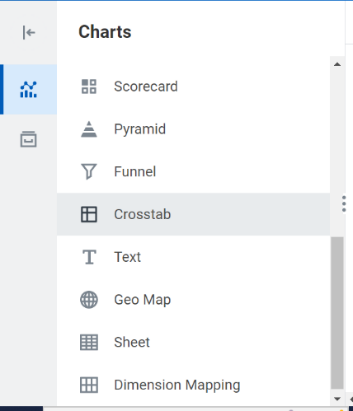
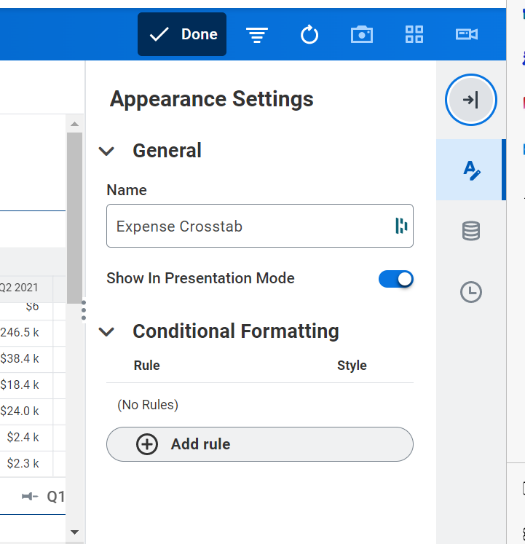
The First Step is selecting the Crosstab option and dragging it onto the plain space. Then we can edit the chart name. This is done by selecting the A in the right corner of your screen and then entering the name that you would like to use. For the sake of this example, the name used is “Expense Crosstab.”

Graphical user interface, application, Word

Description automatically generated
Graphical user interface, application, box and whisker chart

Description automatically generated
Graphical user interface, text, application

Description automatically generated

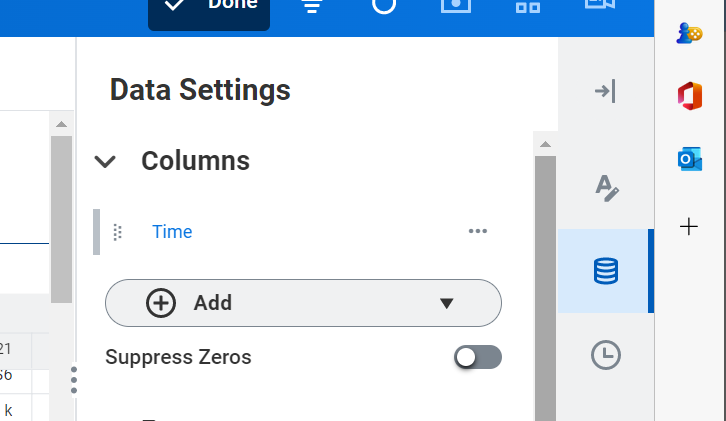
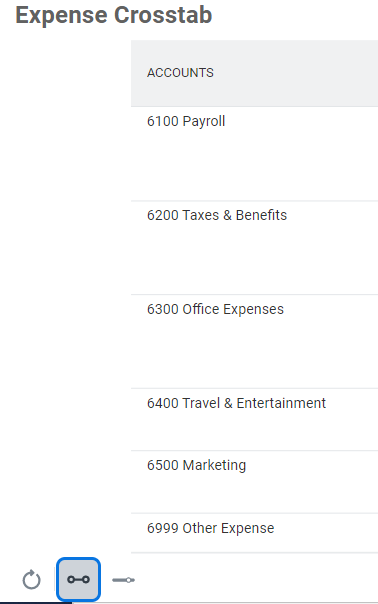
The next step is adding the required accounts and dimensions. In this chart, Columns will be just time, while rows will be both Account and Supervisory Organization. To do this, click the stack of coins below the A on the right side of the screen. Under Columns, select Time, and under rows: Accounts 6100 Payroll, 6200 Taxes and Benefits, 6300 Office Expenses, 6400 Travel and Entertainment, 6500 Marketing, 6999 Other Expenses. You will also Add Supervisory Organization to rows as well. 

Graphical user interface, text, application

Description automatically generated
Graphical user interface, application

Description automatically generated

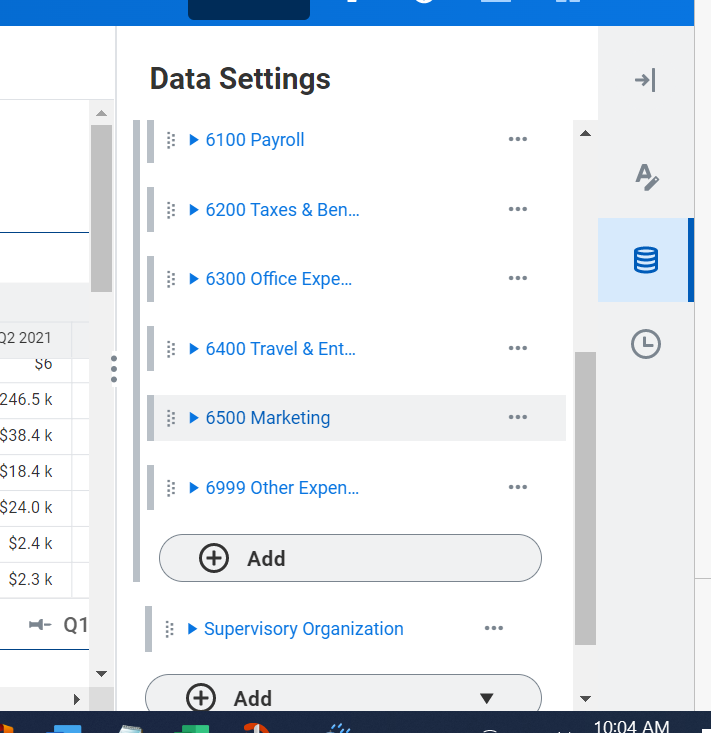
This is what the account will look like:

Graphical user interface, application, Teams

Description automatically generated

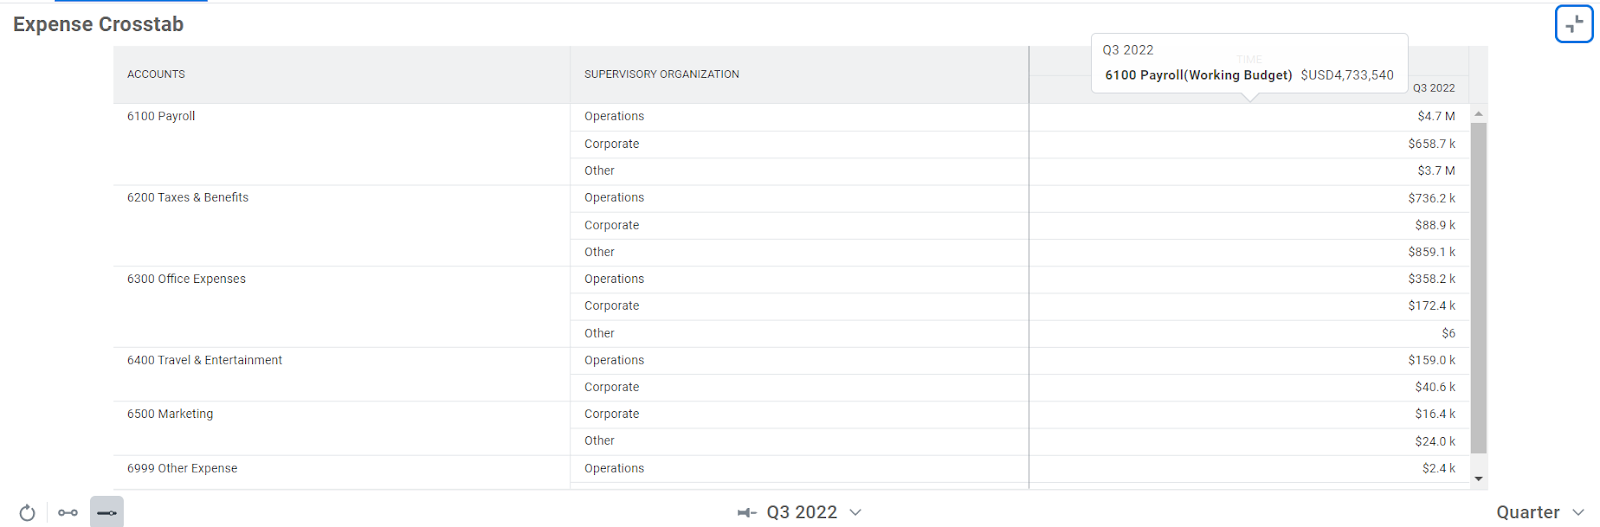
You can edit the time to be monthly, quarterly, or yearly. You can do this in the bottom right corner where it says “Quarter” by clicking and changing it to month or year. As of now, we have just one time period. Let’s make the dashboard a time range with multiple data points. To do this we will click the line with two small circles. 

Graphical user interface, application

Description automatically generated

Now that we have selected this, you can select the time range you would like your Crosstab to display. To adjust the time, click on the time period and make your selection. 

Graphical user interface, application

Description automatically generated

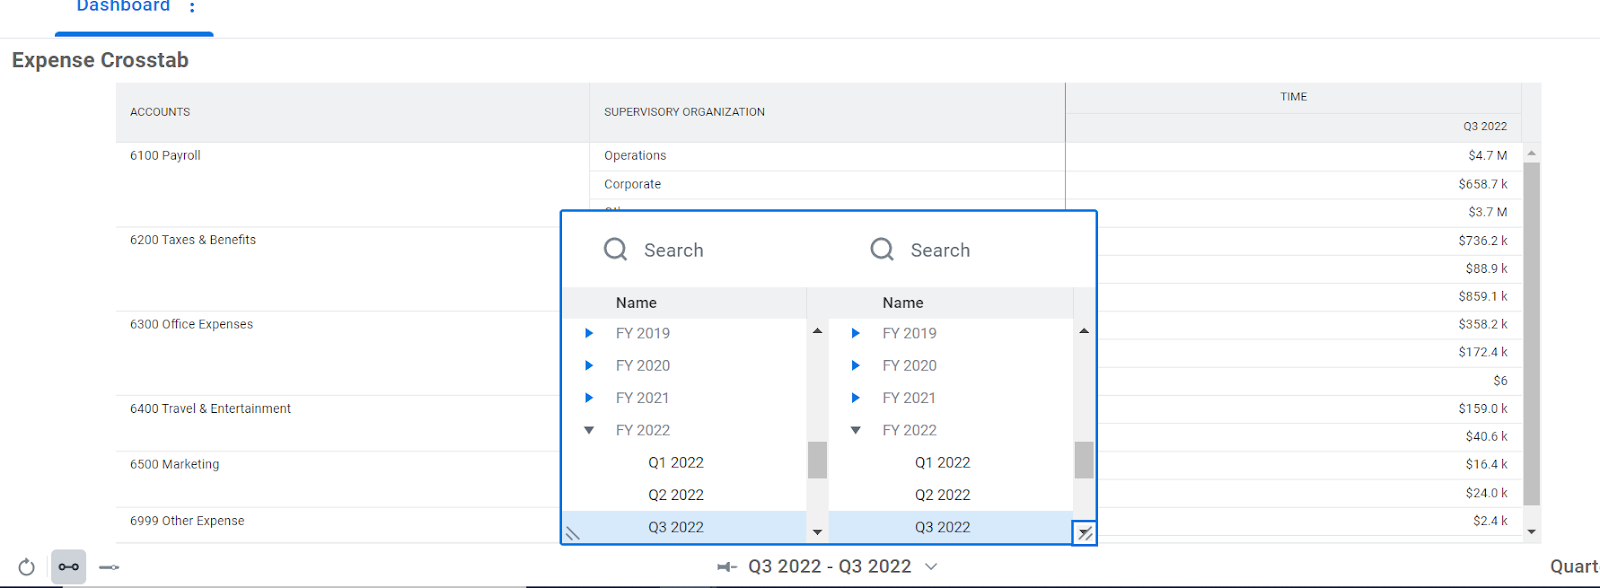
For this example, the range Q1 2021 to Q1 2022 was selected. Below is the final product for the Crosstab.

Table

Description automatically generated

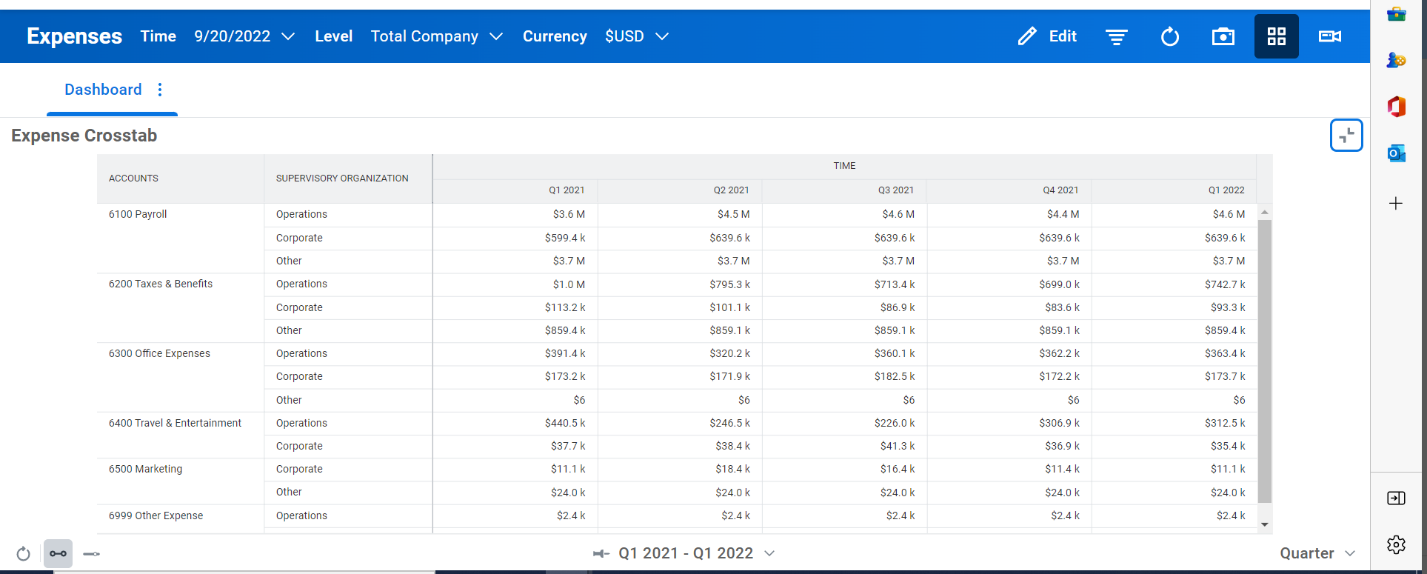
As shown, the Crosstab is a simple but effective way to paint and visualize numbers that any company can use for an easy way to track and analyze finances. 

Read more Workday Adaptive Planning Tips & Tricks:

Workday Adaptive Planning Tips & Tricks: Creating an Excel File Data Source

Workday Adaptive Planning Tips & Tricks: Data Integration and the Planning Data Source

Workday Adaptive Planning Tips & Tricks: Utilizing Split Rows in Modeled Sheets

Author

  • Alex Goldman
    Alex Goldman

    View all posts

    • Categories

      • Awards & Recognition
      • Financial Close & Consolidation
      • FP&A Done Right
      • IBM Planning Analytics Tips & Tricks
      • News & Events
      • Success Stories
      • Tech Bulletins
      • Workday Adaptive Planning Insights
      • Workday Adaptive Planning Tips & Tricks

    Popular Posts

    Authors

    Adam Riskin
    Adam Riskin
    Ailenette Cruz
    Ailenette Cruz
    Alex Goldman
    Alex Goldman
    Ben Alcock
    Ben Alcock
    Brian Combs
    Brian Combs
    Dave Miersch
    Dave Miersch
    Dillon Rossman
    Dillon Rossman
    Gary Leiffer
    Gary Leiffer
    John Pra Sisto
    John Pra Sisto
    Ken Wolf
    Ken Wolf
    Koury Reid
    Koury Reid
    Lee Lazarow
    Lee Lazarow
    Lisa Minneci
    Lisa Minneci
    Marc Assenza
    Marc Assenza
    Mary Luchs
    Mary Luchs
    Michelle Song
    Michelle Song
    Nina Inverso
    Nina Inverso
    Revelwood
    Revelwood
    Robert Nordhagen
    Robert Nordhagen
    Tara Byrnes
    Tara Byrnes
    Wesley DeMarco
    Wesley DeMarco

    Sign up for our newsletter

    Connect

Footer

Revelwood Overview

Revelwood helps finance organizations close, consolidate, plan, monitor and analyze business performance. As experts in solutions for the Office of Finance, we partner with best-in-breed software companies by applying best practices guidance and our pre-configured applications to help businesses achieve their full potential.

EXPERTISE

  • Workday Adaptive Planning
  • IBM Planning Analytics
  • BlackLine

ABOUT

  • Who We Are
  • What We Do
  • How We Help
  • How We Think
  • Privacy

CONNECT

Contact:

25B Vreeland Road, Suite 111 Florham Park, NJ 07932
201.984.3030
info@revelwood.com

Copyright © 2023 · Revelwood Inc. All rights reserved. Revelwood® and the Revelwood logo are registered marks of Revelwood Inc.