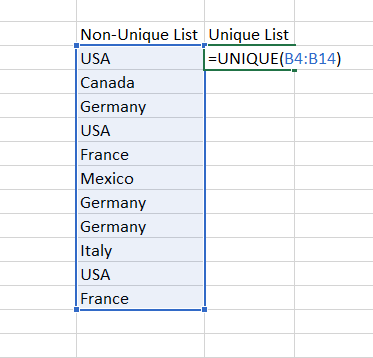
Have you ever needed to produce a list of unique values within a cell range in Excel? If so, the UNIQUE function can do this.
The example below shows a simple list of countries that includes some duplicates:
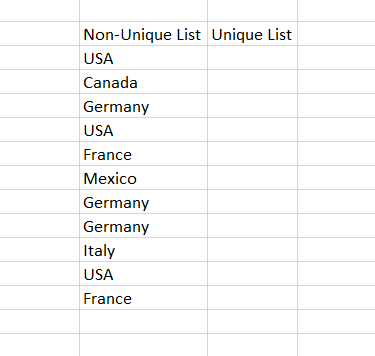
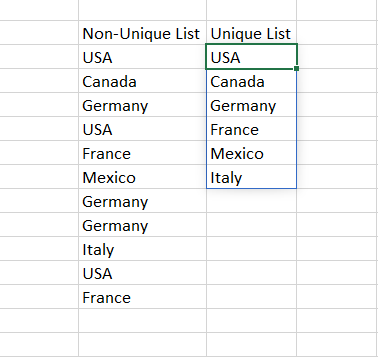
To produce a unique list, simply pass the cell range of the original list into the UNIQUE function.
The unique list of values will “spill” down from the original UNIQUE formula.
This approach will give you a quick and easy way to get unique values from a cell range.
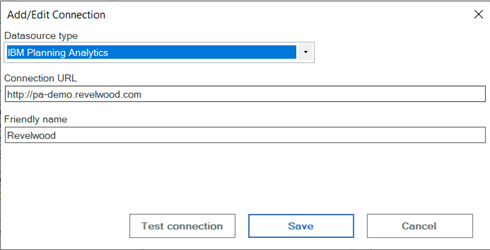
IBM Planning Analytics, which TM1 is the engine for, is full of new features and functionality. Not sure where to start? Our team here at Revelwood can help. Contact us for more information at info@revelwood.com. And stay tuned for more Planning Analytics Tips & Tricks weekly in our Knowledge Center and in upcoming newsletters!
Read more IBM Planning Analytics Tips & Tricks:
IBM Planning Analytics Tips & Tricks: On-Demand Webinars, Part 2
IBM Planning Analytics Tips and Tricks: Upgrading to Planning Analytics for Excel 2.0.65 or later