• Skip to main content
  • Skip to footer
Revelwood Logo

Revelwood

Your SUPER-powered WP Engine Site

  • Who We Are
    • About Us
      • Our Company
      • Our Team
      • Partners
    • Careers
      • Join Our Team
  • What We Do
    • Solutions
      • Workday Adaptive Planning
      • IBM Planning Analytics
      • BlackLine
    • Services
      • Finance Transformation Services
      • Implementation Services
      • Customer Care
        • Help Desk
        • System Administration as a Service
      • Workday Adaptive Planning Integration Center of Excellence
      • Training
        • Workday Adaptive Planning Training
        • IBM Planning Analytics / TM1 Training
    • Products
      • DataMaestro
      • LightSpeed
      • IBM Planning Analytics Utilities
  • How We Help
    • Use Cases
    • Client Success Stories
  • How We Think
    • Knowledge Center
    • Events
    • News
  • Contact Us

Budgeting Planning & Forecasting

IBM Planning Analytics Tips & Tricks: Excel Switch Function

February 20, 2024 by Ivan Cepero

The SWITCH function in Excel evaluates a condition and then provides a result based on that condition. This function is similar to a SQL CASE statement and allows for up to 126 potential results.

The syntax of the SWITCH function is:

=SWITCH(expression, value1, result1, value2, result2, …, no match value)

  • The Expression is the value to be analyzed. This can be any formula, including another Excel formula.
    • The resulting value can be a text string or a decimal.
  • Result1 is the value to be referenced/matched.  This is the result of the expression.
  • Value1 is the replacement (switch) value.  
  • The “no match value” is the result if no matches are found.

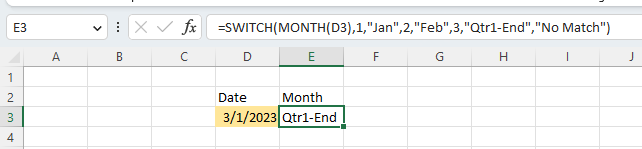
Here is an example of the formula:
Table, Excel

Description automatically generated

This example returns the month short name for January and February but will return ‘Qtr1-End’ for March. If no match is found, the text value “No Match” will be returned.

This approach will allow you to merge IF statements and LOOKUP statements into a single command.

IBM Planning Analytics, which TM1 is the engine for, is full of new features and functionality. Not sure where to start? Our team here at Revelwood can help. Contact us for more information at info@revelwood.com. And stay tuned for more Planning Analytics Tips & Tricks weekly in our Knowledge Center and in upcoming newsletters!

Read more about visualizations in IBM Planning Analytics:

IBM Planning Analytics Tips & Tricks: Excel TEXT Function

Top Three IBM Planning Analytics Tips & Tricks Posts – 2023

IBM Planning Analytics Tips & Tricks: Using the Subset Editor in Planning Analytics Workspace

Home » Budgeting Planning & Forecasting » Page 5

Filed Under: IBM Planning Analytics Tips & Tricks Tagged With: Budgeting Planning & Forecasting, Excel, IBM Cognos TM1, IBM Planning Analytics, TM1

IBM Planning Analytics Tips & Tricks: PAW Generated Statements

February 6, 2024 by Lee Lazarow

One of the great things about IBM Planning Analytics Perspective’s process editor is that the wizard can be used to create code within your scripts. The results of the wizard based statements are inserted within areas called “Generated Statements.”

However, there may be times when you want to change the code within the generated areas. Maybe you want to temporarily disable some lines from running or maybe you want to add a debugging line within the existing section. Perspectives does not allow you to perform this type of task, but Planning Analytics Workspace (PAW) does!

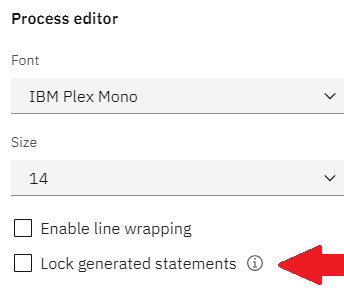
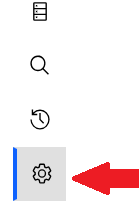
A user preference is built into PAW’s modeling workbench that allows you to either lock or unlock generated statements. You can access this setting by clicking on the preferences icon on a workbench.

From there, you can toggle the Lock Generated Statements option within the Process editor area.

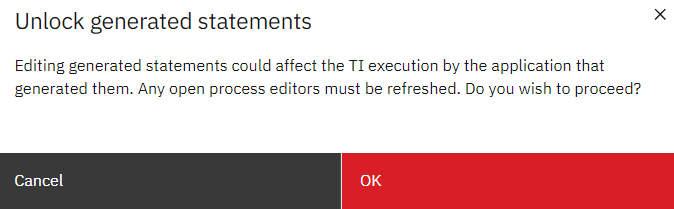
When unlocking, you will need to refresh the script before the system will allow you to make changes within the previously locked area. The following window will appear as a warning:

A screenshot of a computer screen

Description automatically generated

This approach will allow you to quickly modify your generated statements while also providing the ability to easily reenable them for future development.

IBM Planning Analytics, which TM1 is the engine for, is full of new features and functionality. Not sure where to start? Our team here at Revelwood can help. Contact us for more information at info@revelwood.com. And stay tuned for more Planning Analytics Tips & Tricks weekly in our Knowledge Center and in upcoming newsletters!

Read more about visualizations in IBM Planning Analytics:

IBM Planning Analytics Tips & Tricks: Excel TEXT Function

Top Three IBM Planning Analytics Tips & Tricks Posts – 2023

IBM Planning Analytics Tips & Tricks: Using the Subset Editor in Planning Analytics Workspace
Home » Budgeting Planning & Forecasting » Page 5

Filed Under: IBM Planning Analytics Tips & Tricks Tagged With: Budgeting Planning & Forecasting, IBM Cognos TM1, IBM Planning Analytics, Planning Analytics Workspace, TM1

Top Three IBM Planning Analytics Tips & Tricks Posts – 2023

December 19, 2023 by Revelwood

What were your favorite IBM Planning Analytics Tips and Tricks blog posts this year? We took a look at our website analytics and found the top three posts of 2023 are (drumroll, please!) …

IBM Planning Analytics Tips & Tricks: DefineCalc

IBM Planning Analytics for Excel (PAfE) version 80 introduced a new function called “DefineCalc.” This function allows a user to create a custom calculation using TM1/Planning Analytics data via the use of MDX.

IBM Planning Analytics Tips & Tricks: Expanding Sections of Stacked Dimensions

Have you ever been in a situation where you have stacked dimensions in your view and only want to expand one section of it? In legacy Perspectives, an expansion of one area equates to an expansion of all areas. IBM Planning Analytics Workspace (PAW), version 87, introduced functionality that allows you to expand just one piece at a time.

IBM Planning Analytics Tips & Tricks PAW Users and Groups

Do you know how to manage your users and groups in IBM Planning Analytics Workspace (PAW)? As of version 84, PAW now allows you to edit this information via a single click.

IBM Planning Analytics, which TM1 is the engine for, is full of new features and functionality. Not sure where to start? Our team here at Revelwood can help. Contact us for more information at info@revelwood.com. And stay tuned for more Planning Analytics Tips & Tricks weekly in our Knowledge Center and in upcoming newsletters!

Read more IBM Planning Analytics Tips & Tricks:

IBM Planning Analytics Tips & Tricks: Planning Analytics Workspace (PAW) Region Expansion

IBM Planning Analytics Tips & Tricks: How to Determine when Users Logged in to Planning Analytics Workspace

IBM Planning Analytics Tips & Tricks: Excel Substitute Function

Home » Budgeting Planning & Forecasting » Page 5

Filed Under: IBM Planning Analytics Tips & Tricks Tagged With: Budgeting Planning & Forecasting, Financial Performance Management, IBM Cognos TM1, IBM Planning Analytics, TM1

IBM Planning Analytics Tips & Tricks: Planning Analytics Workspace (PAW) Region Expansion

November 28, 2023 by Lee Lazarow

A while back I wrote a blog about regions within regions in IBM Planning Analytics. This approach allows you to make your rules easier to navigate and read when scrolling through many lines of code.  

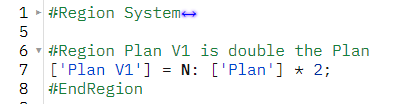
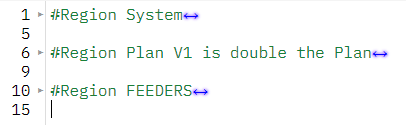
As you create regions, you can expand and contract lines of code by clicking the arrow next to the applicable lines. Here is an example of a contracted region (line 1) and an expanded region (line 6):

Text

Description automatically generated

But did you know that Planning Analytics Workspace allows you to expand or contract all regions at the same time? The workbench ribbon contains icons to expand (called “unfold”) and contract (called “Fold”) all regions with a single click.The left icon below is used for expansion and the right icon below is used for contraction.

Here is an example of 15 lines of code with the use of regions.

Text

Description automatically generated with medium confidence

This approach will allow you to reduce your screen footprint and make it even easier to quickly navigate through your code.  

IBM Planning Analytics, which TM1 is the engine for, is full of new features and functionality. Not sure where to start? Our team here at Revelwood can help. Contact us for more information at info@revelwood.com. And stay tuned for more Planning Analytics Tips & Tricks weekly in our Knowledge Center and in upcoming newsletters!

Read more IBM Planning Analytics Tips & Tricks:

IBM Planning Analytics Tips & Tricks: Cell Security in Planning Analytics Workspace

IBM Planning Analytics Tips and Tricks: Trusting the Directory where the Planning Analytics for Excel xll file resides

IBM Planning Analytics Tips & Tricks: Planning Analytics Workspace (PAW) Process Error Logs

Home » Budgeting Planning & Forecasting » Page 5

Filed Under: IBM Planning Analytics Tips & Tricks Tagged With: Budgeting Planning & Forecasting, IBM Cognos TM1, IBM Planning Analytics, TM1

IBM Planning Analytics Tips & Tricks: How to Determine when Users Logged in to Planning Analytics Workspace

November 14, 2023 by Revelwood

Have you ever wanted to learn when a user last logged in to IBM Planning Analytics Workspace (PAW)? Or to generate a list of dates and times when users logged in?

IBM Planning Analytics version 87 includes a feature to easily figure out the last login time of your PAW users.

Watch this short video from Lee Lazarow, Revelwood’s Planning Analytics practice lead. You’ll see Lee demonstrate how to:

  • Find ‘Users and Groups’, which contains the date and time of logins.
  • Download that information into a CSV file you can save
  • Learn the roles, dates and times of logins

This approach gives us the ability to quickly create a list of all of our users and for each one of our users, a date and time associated with the last login.

IBM Planning Analytics, which TM1 is the engine for, is full of new features and functionality. Not sure where to start? Our team here at Revelwood can help. Contact us for more information at info@revelwood.com. And stay tuned for more Planning Analytics Tips & Tricks weekly in our Knowledge Center and in upcoming newsletters!

Read more IBM Planning Analytics Tips & Tricks:

IBM Planning Analytics Tips & Tricks: Cell Security in Planning Analytics Workspace
IBM Planning Analytics Tips and Tricks: Trusting the Directory where the Planning Analytics for Excel xll file resides

IBM Planning Analytics Tips & Tricks: Planning Analytics Workspace (PAW) Process Error Logs

Home » Budgeting Planning & Forecasting » Page 5

Filed Under: IBM Planning Analytics Tips & Tricks Tagged With: Budgeting Planning & Forecasting, IBM Cognos TM1, IBM Planning Analytics, TM1

IBM Planning Analytics Tips & Tricks: Planning Analytics Workspace (PAW) Process Error Logs

September 26, 2023 by Lee Lazarow

Do you know how to use IBM Planning Analytics Workspace (PAW) to access error logs from your TurboIntegrator (TI) processes? It’s as simple as a single click!

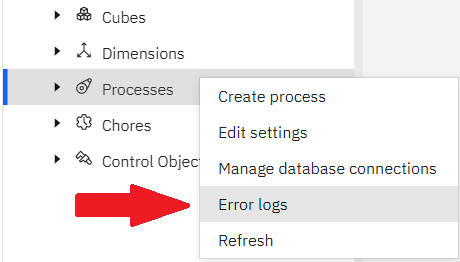
To access your logs, right-click on the Processes node in the workbench and select the option for Error logs.

Once selected, a popup window will appear with a list of the existing logs. This window allows you to sort the list by process name or by date created.

There are two ways to view a log file:

  • Click on the box to the left of the process name
  • Click on the three vertical dots to the right of the date

Both methods will then let you view the log file or download the file.

This feature, when combined with PAW’s development tools, will allow you to fully develop and debug TurboIntegrator scripts using the PAW interface.

IBM Planning Analytics, which TM1 is the engine for, is full of new features and functionality. Not sure where to start? Our team here at Revelwood can help. Contact us for more information at info@revelwood.com. And stay tuned for more Planning Analytics Tips & Tricks weekly in our Knowledge Center and in upcoming newsletters!

Read more IBM Planning Analytics Tips & Tricks:

IBM Planning Analytics Tips & Tricks: Adding Images to Charts

IBM Planning Analytics Tips & Tricks: Popular Video Tips, Part 3

IBM Planning Analytics Tips & Tricks: Counting Hidden Rows in Excel

Home » Budgeting Planning & Forecasting » Page 5

Filed Under: IBM Planning Analytics Tips & Tricks Tagged With: Budgeting Planning & Forecasting, IBM Cognos TM1, IBM Planning Analytics, Planning Analytics Tips & Tricks, TM1

IBM Planning Analytics Tips & Tricks: Creating Charts in Planning Analytics Workspace 

July 18, 2023 by Revelwood

Charts can be an incredibly powerful tool for communicating complex data in an accessible and visually appealing way. In the world of enterprise planning, IBM Planning Analytics provides users with the ability to create detailed and informative charts through its workspace interface, Planning Analytics Workspace (PAW).
This blog post is based on a recent webinar on creating PAW charts in the New Experience. We explore some of the key features and techniques for creating charts in PAW and how they can help your organization make more informed decisions.

Getting Started: The Basics of PAW

Before getting into creating charts, it’s worth taking a quick look at the basics of PAW and how it works. PAW is a web-based interface that allows users to easily access and analyze data stored within IBM Planning Analytics. It includes a range of features and tools for exploration, analysis, and reporting, with the ability to create custom dashboards, reports, and visualizations.

PAW offers two different versions, Classic and the New Experience. While the Classic version is still available, the New Experience offers a more modern and intuitive user interface, with added applications and plans, Watson-related components, and changes to administration and charting functions.

Types of Visualizations

Once you have a basic understanding of PAW, it’s time to start exploring the different types of visualizations that can be created. PAW offers a variety of chart types that can help you visualize your data, including comparison, composition, and trend charts.

Comparison charts are useful when you want to compare two or more data series side-by-side, such as comparing actual versus forecasted revenue. Composition charts, on the other hand, are used to show the composition of a single data series, such as the breakdown of sales by product category. Trend charts are ideal for highlighting trends and patterns over time, such as changes in website traffic or sales revenue.

Creating a Chart: The Three Approaches

When it comes to creating a chart in PAW, there are three main approaches you can take. The first is to convert an existing Exploration to a chart, which can be done using drag-and-drop functionality and a subset editor. This approach is great when you already have an Exploration with the data you want to visualize.

The second approach is to duplicate an existing chart and make tweaks to it as needed. This is useful when you want to create multiple similar charts quickly without having to start from scratch each time.

Finally, the third approach is to manually create a visualization from scratch in a book. This approach allows for the most customization, as you can define the axes, filters, and formatting of the chart yourself.

Once you’ve chosen your approach, it’s time to start customizing your chart. PAW provides a range of options for bars, length, start, target, repeat, and filters, allowing you to fine-tune your visualization to best suit your needs. You can also add value labels to the chart to provide additional context and make it easier for viewers to understand the data being presented.

Tips for Effective Chart Design

While creating a chart in PAW is relatively straightforward, there are some best practices to keep in mind to ensure your chart is as effective as possible. Here are a few tips to consider:

  • Consider your audience: Who will be viewing your chart? Make sure the design and content are appropriate for your intended audience.
  • Keep it simple: Don’t try to cram too much information onto one chart. Focus on the key data points and keep the design clean and uncluttered.
  • Use the right chart type: Make sure you choose the chart type that best suits the data you are presenting and the story you want to tell.
  • Label everything: Be sure to label all axes, data points, and categories to ensure your chart is clear and easy to understand.
  • Use color wisely: Colors can be a great way to highlight important data points, but be sure to use them sparingly and consistently across all your charts.

Conclusion

Creating charts in PAW can be a powerful way to communicate complex data in a clear and accessible way. With a range of chart types and customization options, PAW provides users with the tools they need to create informative and visually appealing visualizations. Keep these tips in mind as you start experimenting with creating charts in PAW, and you’ll be on your way to creating clear, compelling reports that drive informed decision-making.

IBM Planning Analytics, which TM1 is the engine for, is full of new features and functionality. Not sure where to start? Our team here at Revelwood can help. Contact us for more information at info@revelwood.com. And stay tuned for more Planning Analytics Tips & Tricks weekly in our Knowledge Center and in upcoming newsletters!

Read more IBM Planning Analytics Tips & Tricks:

IBM Planning Analytics Tips & Tricks: PAW Set Editor Remove Duplicates

IBM Planning Analytics Tips & Tricks: Popular Posts, Part 1

IBM Planning Analytics Tips & Tricks: Run TI Processes from PAx Task Pane

Home » Budgeting Planning & Forecasting » Page 5

Filed Under: IBM Planning Analytics Tips & Tricks Tagged With: Budgeting Planning & Forecasting, IBM Cognos TM1, IBM Planning Analytics, IBM Planning Analytics Tips & Tricks, TM1

Professional Services Firms Need Future-Ready Forecasting

June 29, 2023 by Revelwood

FP&A Done Right

This is an excerpt from a blog post from our partner Workday Adaptive Planning. It highlights some approaches for professional services firms to keep up with the breakneck pace of work.

Professional services firms don’t have the luxury of gradually adjusting to an evolving digital environment. For them, the digital future is pretty much here. More than one-third of professional services firms expect that at least 75% of their revenue will come from digital by 2025, according to a report by PwC and Workday.

As an additional sign of the changing times, a growing proportion of firms are investing more than $50 million in artificial intelligence (AI), machine learning (ML), and advanced analytics, according to the report. And with recent advances in generative AI, investments are likely to continue to grow. That’s further blurring the line between professional services and digital services—a distinction that will only get fuzzier in the future. 

“Digital first is our new reality. That isn’t going to change,” shared Joe Golden, vice president of services, IBM, at a Workday event.

Yet, despite how adroitly many professional services firms adapted to wide-scale changes brought on by the pandemic, some lack visibility around past behavior and likely future outcomes. “Professional services organizations can be surprisingly opaque when it comes to insight,” IDC reports.

To succeed, firms must solve their data, talent, and technology challenges. But many have yet to embrace this new reality. Among professional services leaders, 57% say there’s a growing gap between where their business is and where it needs to be to compete, according to a recent Workday study on digital transformation. And only 23% say their digital strategy allows them to keep pace with or exceed the demands of the business.

Firms will need to bolster their access to high-quality, always-available data, along with having staff with the necessary data literacy skills to make sense of it all. Of companies with fully-accessible data, 76% say they are well-equipped digitally to ensure business continuity in times of crisis, Workday finds. Small wonder, then, that advanced analytics and data visualization are the skills most sought after by IT leaders (35%) and finance leaders (34%).

“Access to data is the crux of most technology issues in any company,” says Jennifer LaClair, CFO, Ally Financial.

To better understand what the future might hold for professional services firms, industry thought leaders shared their predictions for three of the biggest trends the industry will face. The following excerpt focuses on how professional services firms can benefit from more sophisticated forecasting.

Data Silos Disappear as Organizations Race to Future-Ready Forecasting and Adaptability

To drive productivity and profit and to forecast accurately, future-forward professional services firms will need more integration and less separation of their people and systems. “Today’s professional services organizations simply cannot operate with functional silos as the lines between sales, delivery, and finance become blurred,” SPI asserts.

Unfortunately, these organizations’ data too often sits trapped within silos. “The reason most companies can’t forecast their revenue more accurately is because they have different systems and data across their lines of businesses and services,” Joseph says. “And all those different systems mean that you have data that’s going to be wildly inconsistent.”

Almost half (49%) of business leaders—and almost two-thirds (62%) of professional services leaders—say their inability to connect operational, people, and financial data to business outcomes impairs the organization’s agility, according to a Workday survey of senior business executives. 

But firms with accessible data tell a different story, the Workday survey reveals. A towering 85% of leaders whose companies enjoy fully accessible data say the organization can embrace change readily. All of which points to the urgent need to overcome siloed data sources.

For ERPA, a consulting and enterprise application managed services firm, adopting professional services automation slashed the time needed to calculate revenue from a full day to just 15 minutes. And the firm gained a stronger forecasting ability in the process. 

“From week to week, we’re able to get a really good sense of our forecasted revenue for projects in the next four to 12 weeks,” says Jon Milkovich, director of Workday financials at ERPA. “So it’s really provided a lot better real-time insight into what our forecasted revenue will be.”

That’s a need that best-in-class firms are meeting head-on. They’re 82% more likely than other firms to be able to share financial and operational data with the extended enterprise through a central repository, Aberdeen finds in its report: “Leverage Demand Planning and Forecasting for Best-in-Class Performance During Volatile Times.”

Learn more about how professional services firms can adapt and change in our recent webinar, Streamlining Professional Business Services with Workday Adaptive Planning.

Read the full blog post on the Workday blog.

More from our FP&A Done Right Series:

Enterprise Planning Helps Professional Services Firms Adapt to Changes

FP&A Done Right: Trends in Accounting and Finance

Leveraging IBM Planning Analytics for xP&A

Home » Budgeting Planning & Forecasting » Page 5

Filed Under: Finance Transformation Tagged With: Budgeting Planning & Forecasting, Financial Performance Management, Planning & Forecasting, Workday, Workday Adaptive Planning

IBM Planning Analytics Tips & Tricks: Headcount Analysis

June 27, 2023 by Revelwood

Did you miss our recent webinar on headcount analysis? Here’s a high-level recap of what we covered. In short, IBM Planning Analytics is a powerful, flexible tool for headcount analysis. 

Headcount analysis is a critical component of any organization’s workforce planning and management strategy. Headcount analysis helps organizations understand their staffing requirements, analyze performance metrics, and identify areas of inefficiency that can be addressed through better HR practices. IBM Planning Analytics provides powerful capabilities for headcount analysis. In this blog post, we will explore headcount analysis with IBM Planning Analytics and discuss key features and benefits of this solution.

Watch the webinar here!

IBM Planning Analytics enables organizations to create sophisticated headcount models that can track a wide range of metrics related to employee performance, retention rate, demographics, compensation, and benefits. With Planning Analytics, organizations can analyze trends in headcounts, understand factors driving variations in headcounts, and identify opportunities to optimize their workforce. For example, you can use Planning Analytics to compare headcounts across different geographies or business units and to identify trends in staffing changes over time.

The solution provides a flexible and user-friendly interface that makes it easy for HR teams and other stakeholders to analyze headcount data. They do not need to be Planning Analytics power users. Planning Analytics includes a variety of pre-built dashboards, reports, and visualizations that enable users to explore and collaborate on data. Users can drill down into specific data points, filter data based on different criteria, and customize their views to suit their needs. The solution also includes a built-in report writer that enables users to create customized reports with ease. 

IBM Planning Analytics integrates seamlessly with a variety of data sources, such as ERP and HR systems, to provide a holistic view of headcount data. This means that organizations can extract data from multiple sources and integrate it into a single model for analysis, without having to rely on complex data transformations or manual data entry. This integration capability also ensures that headcount data is accurate and up to date, which is essential for effective decision-making.

Additionally, IBM Planning Analytics provides advanced analytics features such as predictive analytics, what-if scenarios, and trend analysis that enable organizations to forecast future headcount requirements, costs, and risks. Predictive analytics models can use historical data and machine learning algorithms to predict future staffing demands and highlight areas of staffing volatility. What-if scenarios enable organizations to simulate the impact of different staffing strategies, such as hiring freezes or increased retention efforts. And trend analysis enables organizations to understand the impact of different factors on headcount, such as seasonality, economic trends, and business cycles.

The solution also provides robust collaboration and workflow capabilities that enable HR teams to work together effectively and efficiently. The solution includes a variety of collaboration features such as commenting, task assignment, and alerts that enable teams to share information and coordinate efforts. The solution also includes powerful workflow features that enable teams to automate routine tasks and streamline processes, such as approvals and reviews.

Finally, IBM Planning Analytics provides security features that ensure the confidentiality and privacy of headcount data. The solution includes granular access controls, data encryption, and other security measures that enable organizations to protect their sensitive data. The solution is also compliant with a variety of security and privacy regulations, such as GDPR and HIPAA.

In conclusion, headcount analysis is a critical component of any organization’s workforce planning and management strategy. IBM Planning Analytics is an advanced analytics solution that provides powerful capabilities for headcount analysis. The solution enables organizations to create sophisticated headcount models, analyze trends in headcounts, and forecast future headcount requirements, costs, and risks. The solution also provides a user-friendly interface, integrates seamlessly with a variety of data sources, provides advanced analytics features, enables robust collaboration and workflow, and includes security features that ensure the confidentiality and privacy of headcount data. If you’re looking to optimize your workforce and improve your HR practices, IBM Planning Analytics is a solution worth exploring. Interested in learning how to leverage your investment in Planning Analytics by adding headcount analysis into your environment? Let us know – we can help!

IBM Planning Analytics, which TM1 is the engine for, is full of new features and functionality. Not sure where to start? Our team here at Revelwood can help. Contact us for more information at info@revelwood.com. And stay tuned for more Planning Analytics Tips & Tricks weekly in our Knowledge Center and in upcoming newsletters!

Read more IBM Planning Analytics Tips & Tricks:

IBM Planning Analytics Tips & Tricks: PAW Set Editor Remove Duplicates

IBM Planning Analytics Tips & Tricks: Popular Posts, Part 1

IBM Planning Analytics Tips & Tricks: Run TI Processes from PAx Task Pane

Home » Budgeting Planning & Forecasting » Page 5

Filed Under: IBM Planning Analytics Tips & Tricks Tagged With: Budgeting Planning & Forecasting, Financial Performance Management, IBM Cognos TM1, IBM Planning Analytics, TM1

  • « Go to Previous Page
  • Page 1
  • Interim pages omitted …
  • Page 3
  • Page 4
  • Page 5
  • Page 6
  • Page 7
  • Interim pages omitted …
  • Page 27
  • Go to Next Page »

Footer

Revelwood Overview

Revelwood helps finance organizations close, consolidate, plan, monitor and analyze business performance. As experts in solutions for the Office of Finance, we partner with best-in-breed software companies by applying best practices guidance and our pre-configured applications to help businesses achieve their full potential.

EXPERTISE

  • Workday Adaptive Planning
  • IBM Planning Analytics
  • BlackLine

ABOUT

  • Who We Are
  • What We Do
  • How We Help
  • How We Think
  • Privacy

CONNECT

World Headquarters

Florham Park, NJ | 201 984 3030

European Headquarters

London & Edinburgh | +44 (0)131 240 3866

Email
info@revelwood.com

Copyright © 2026 · Revelwood Inc. All rights reserved. Revelwood® and the Revelwood logo are registered marks of Revelwood Inc.