This is a guest blog post by Revelwood’s Susan Musselman.
Did you know you can not only set up a landing page for IBM Cognos TM1 Web, but you can also set up custom landing pages for different groups of users? Here’s a quick step-by-step guide to do this.
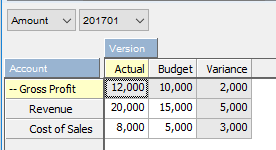
The landing page for users is set up in the }ClientSettings cube:
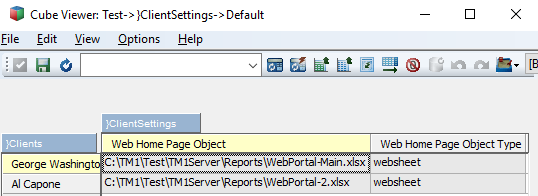
In the above example, George Washington will see the Main Portal when he logs in and Al Capone will see Portal-2. There are 3 easy steps to set this up:
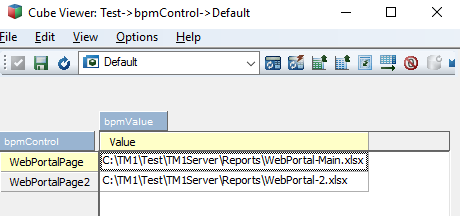
Create elements in the Control Cube and populate control cube to define the path of the portal pages: the }ClientSettings cube:
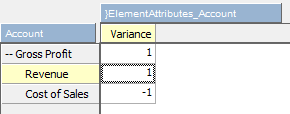
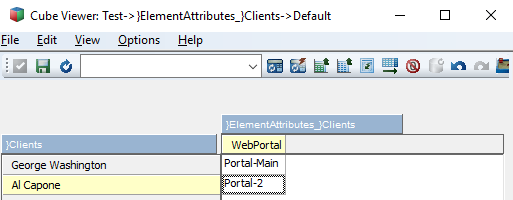
Create a WebPortal attribute in the }Client dimension and populate for your users:
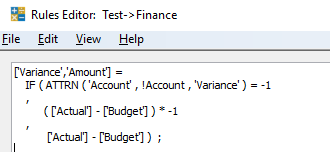
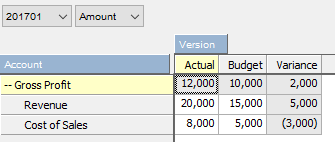
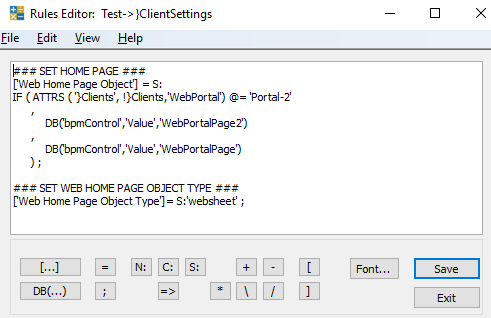
Create a rule in the }ClientSettings cube to determine which websheet to use for each }Client based on the attribute in the }ElementAttributes_}Clients cube:
IBM Planning Analytics, which TM1 is the engine for, is full of new features and functionality. Not sure where to start? Our team here at Revelwood can help. Contact us for more information at info@revelwood.com. And stay tuned for more Planning Analytics Tips & Tricks weekly in our Knowledge Center and in upcoming newsletters!
Read more blog posts with Tips & Tricks for IBM Planning Analytics:
Tips & Tricks for using IBM Planning Analytics: Creating URLs for TM1 Websheets
IBM Planning Analytics Tips & Tricks: Creating Dynamic, Attractive Views and Dashboards
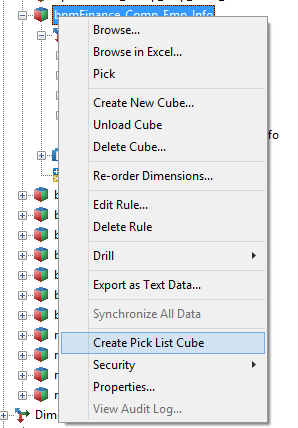
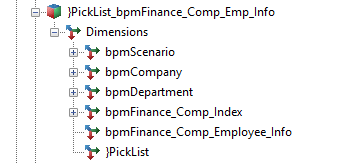
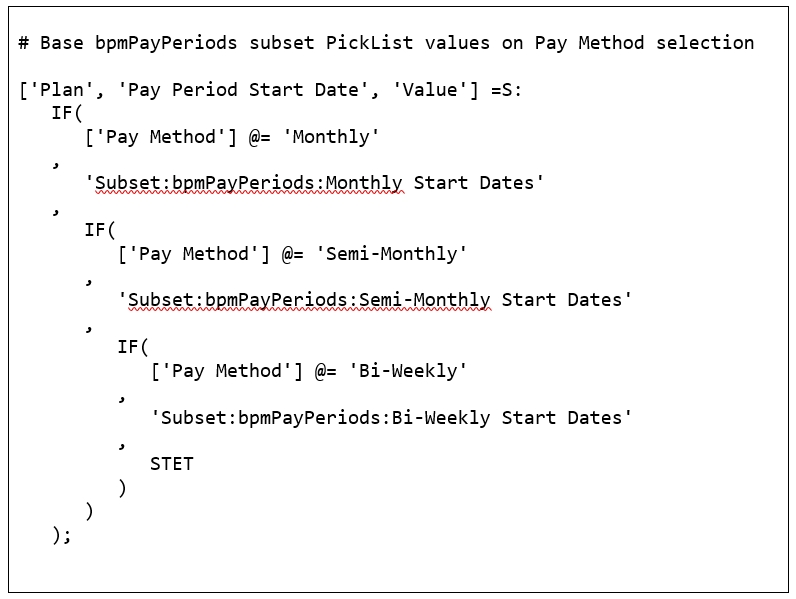
Tips & Tricks for using IBM Planning Analytics: Creating TM1/Planning Analytics Picklist Cubes