The fast-paced world of business requires insightful decision-making. Organizations need to harness data effectively to make truly data-based decisions. Many companies today struggle with their ability to leverage technology to capture and compile crucial enterprise data for impactful decision-making.
Current Landscape: Challenges in FP&A
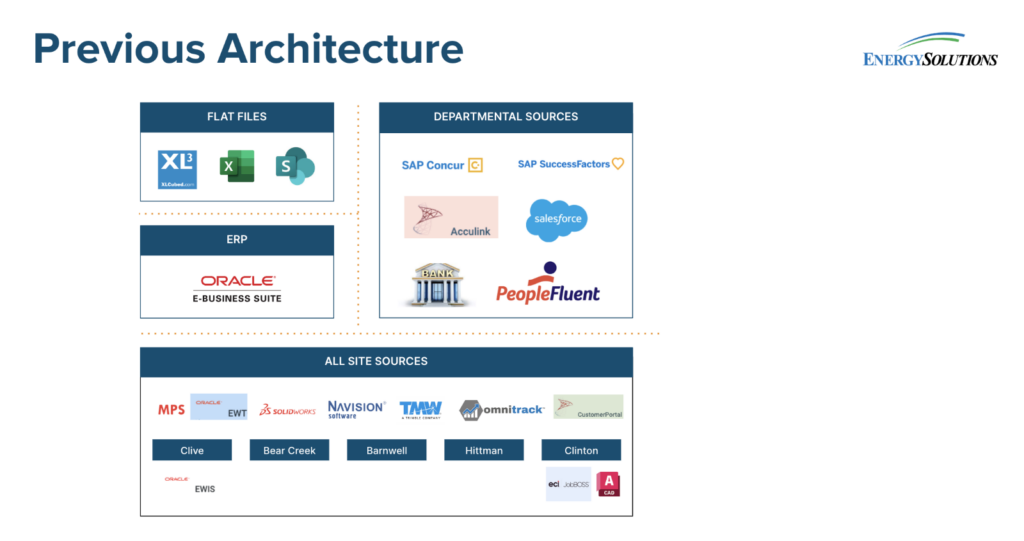
According to a study from Forrester Consulting, enterprises face a daunting task in managing data from as many as 700 different sources for downstream analytics and business intelligence applications. Organizations need this data to keep up with the speed of business, especially when considering factors such as high inflation, rising interest rates, geopolitical disruptions and the lingering effects of supply chain shocks.
Our partner Incorta recently surveyed finance leaders on the allocation of time within the finance department. The data collected points to some challenges in FP&A processes:
- Working with complex financial and operational data
- Team members working in offline Excel
- Inconsistencies in taxonomy and definitions
- Outdated data
- A lack of a single, trusted data source.
These challenges contribute to FP&A teams spending a considerable amount of time on low-value activities such as data collection and validation, hindering their ability to focus on high-value strategic activities.
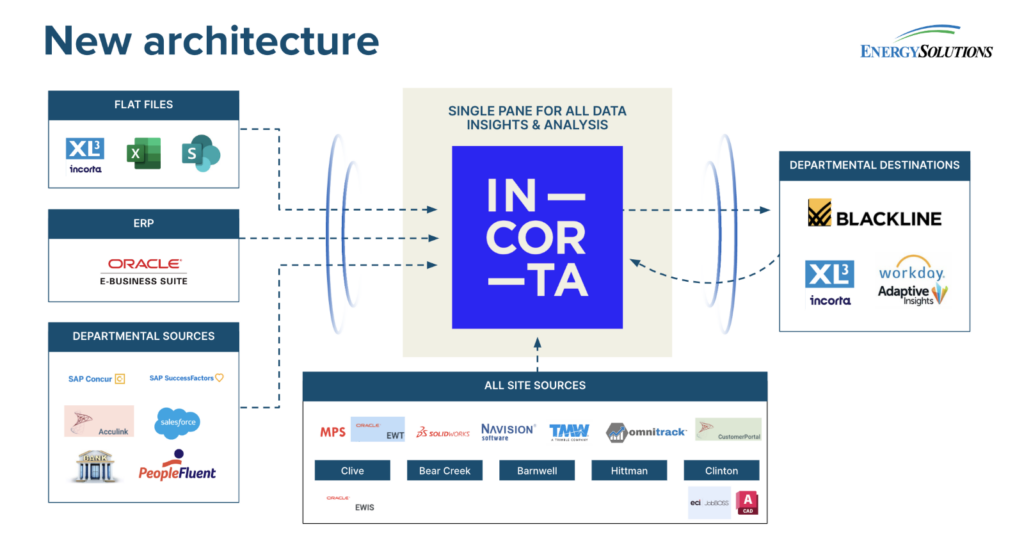
Organizations can overcome these challenges by using a data hub. A comprehensive solution can provide:
- Access to Fresh Enterprise Data
- Streamlined Financial Processes through immediate access to organizational data
- Improved decision-making by reducing deployment times for baseline reports
- A unified view of data
- Integration with existing systems
Incorta provides details on the survey in “Analytical Freedom at Last: Financial Planning and Analysis Reimagined.” Download your copy today.
Read more about Data Analytics in Finance:
How GenAI Will Impact Data Analytics
Increasing Accuracy in Forecasts by Using Workday Adaptive Planning with Incorta
EnergySolutions Makes Faster Data-Driven Decisions with Incorta