• Skip to main content
  • Skip to footer
Revelwood Logo

Revelwood

Your SUPER-powered WP Engine Site

  • Who We Are
    • About Us
      • Our Company
      • Our Team
      • Partners
    • Careers
      • Join Our Team
  • What We Do
    • Solutions
      • Workday Adaptive Planning
      • IBM Planning Analytics
      • BlackLine
    • Services
      • Implementation Services
      • Customer Care
        • Help Desk
        • System Administration as a Service
      • Training
        • Adaptive Planning Training
        • IBM Planning Analytics / TM1 Training
    • Products
      • DataMaestro
      • LightSpeed
      • IBM Planning Analytics Utilities
  • How We Help
    • Workday Adaptive Planning Use Cases
    • IBM Planning Analytics Use Cases
    • BlackLine Use Cases
    • Client Success Stories
  • How We Think
    • Knowledge Center
    • Events
    • News
  • Contact Us

Business Intelligence

IBM Planning Analytics Tips & Tricks: Planning Analytics Virtual Hierarchies in Cognos Analytics

March 5, 2019 by Revelwood Leave a Comment

Tips & Tricks

This is a guest blog post from Revelwood’s Jay Apwah.

Did you know that you can access Planning Analytics Virtual Hierarchies in Cognos Analytics?

Prior to Planning Analytics 2.0 (PA) and Cognos Analytics 11.0.6 (CA) the limiting factor in reporting cube design was related to product limitations that existed in CA at the time. In order to use level-based or relative functions in CA, one had to name the levels of the reporting dimensions. This required the PA developer to limit each reporting dimension to one root consolidation and to maintain a balanced structure in each of those dimensions. Furthermore, in order to perform analysis by element attributes or alternate element roll-ups, additional attribute dimensions and/or additional dimensions that represented the alternate roll-ups needed to be added to the reporting cubes. Sometimes that led to reporting cubes with a seemingly unnecessarily large number of dimensions which led to messy and sometimes confusing ad-hoc reporting in CA.

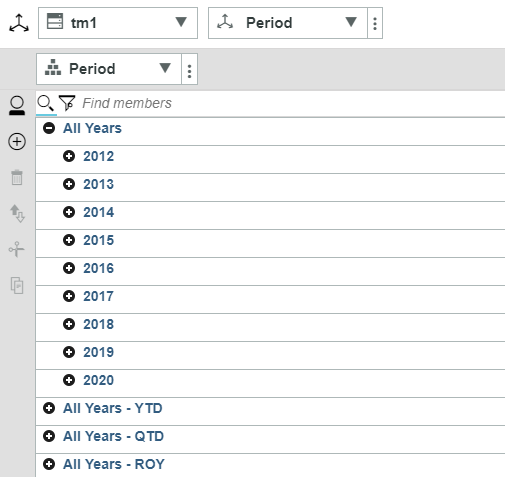
Cognos Analytics 11.0.6 allows you to leverage PA virtual hierarchies. You no longer need to create and add additional dimensions to the reporting cube in order to report on attributes or roll-up dimension elements differently.  In the following example, the time dimension called bpmPeriod has several alternate roll-ups. The number of levels in each alternate roll-up structure is different which means that we cannot properly name levels in the }HierarchyProperties cube.

IBM Planning Analytics Tips & Tricks: Planning Analytics Hierarchies in Cognos Analytics

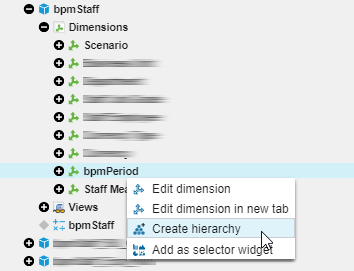
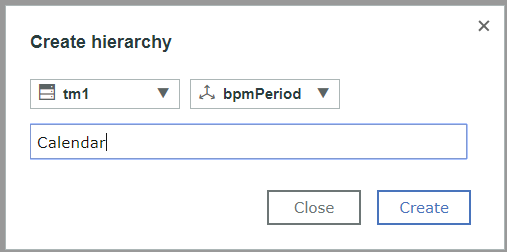
We’re first going to isolate the node called “All Years” with a PA virtual hierarchy. In Planning Analytics Workspace (PAW), we will create a new hierarchy called “Calendar”. Note: there are many different ways to create hierarchies in PA.  This examples uses the PAW interface.

IBM Planning Analytics Tips & Tricks: Accessing Planning Analytics Virtual Hierarchies in Cognos Analytics
IBM Planning Analytics Tricks: Planning Analytics Virtual Hierarchies in Cognos Analytics

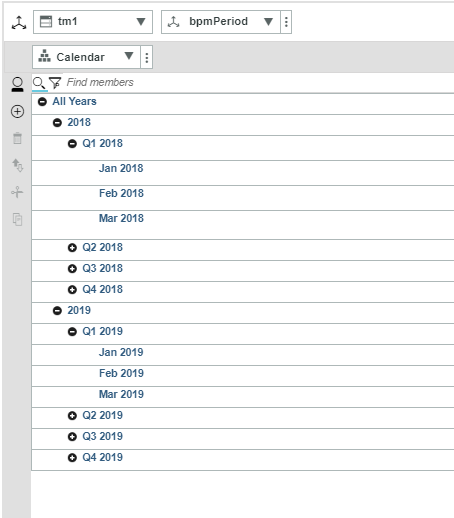
The structure of the calendar hierarchy is as follows: All Years > Year > Quarter > Month:

IBM Planning Analytics Tips: Planning Analytics Virtual Hierarchies in Cognos Analytics

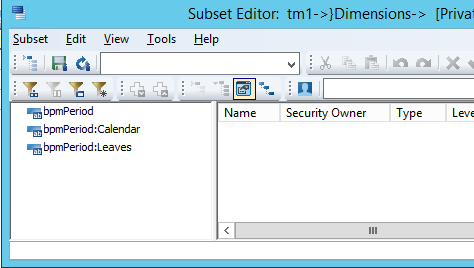
When you create a hierarchy in PAW a new “Leaves” hierarchy is automatically created. You can see the existing the “Calendar” hierarchy and the new “Leaves” hierarchy in the }Dimensions control dimension:

Planning Analytics Virtual Hierarchies in Cognos Analytics. IBM Planning Analytics Tips & Tricks

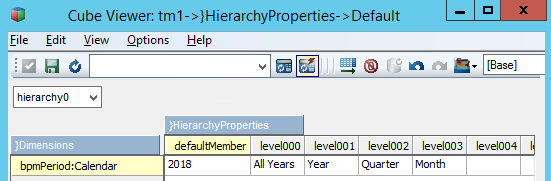
The next step is to logically name the levels of the Calendar hierarchy using the }HierarchyProperties control cube:

Planning Analytics Virtual Hierarchies in Cognos Analytics. IBM Planning Analytics Tips.

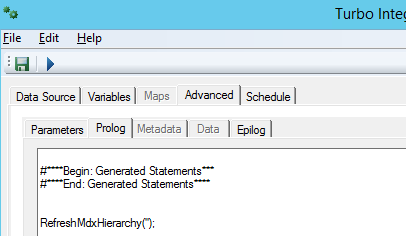
Then create and execute a TI process with the “RefreshMdxHierarchy()” function in the prolog

Planning Analytics Virtual Hierarchies in Cognos Analytics. IBM Planning Analytics Tricks.

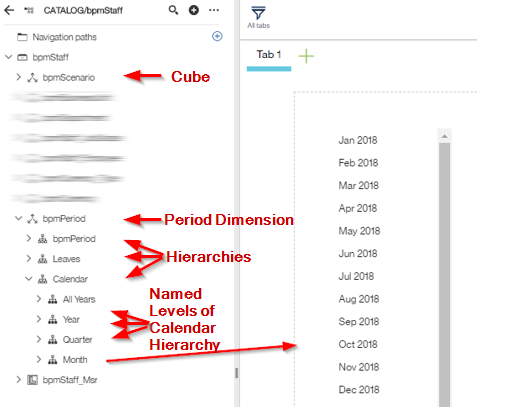
Within Cognos Analytics, you now have access to the bpmPeriod dimension as it exists normally and also have access to all of the virtual hierarchies and their named levels for use with level-based, relative functions. This will make your ad-hoc reporting easier to create.

IBM Planning Analytics Tips & Tricks: Accessing Planning Analytics Virtual Hierarchies in Cognos Analytics

IBM Planning Analytics is full of new features and functionality. Not sure where to start? Our team here at Revelwood can help. Contact us for more information at info@revelwood.com. And stay tuned for more Planning Analytics Tips & Tricks weekly in our Knowledge Center and in upcoming newsletters!

Read more IBM Planning Analytics Tips & Tricks:

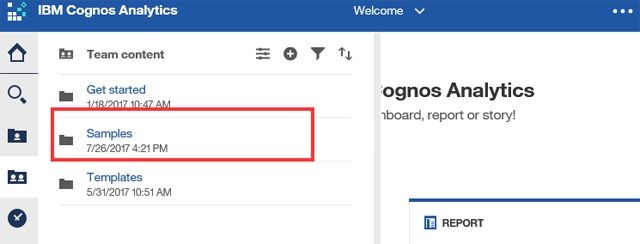
IBM Planning Analytics Tips & Tricks: Installing Cognos Analytics Samples

IBM Planning Analytics Tips & Tricks: Writing Rules

IBM Planning Analytics Tips & Tricks: Duplicating Sheets

Need more help with IBM Planning Analytics? Learn about our Customer Care program.

Home » Business Intelligence

Filed Under: IBM Planning Analytics Tips & Tricks Tagged With: Analytics, Budgeting, Budgeting Planning & Forecasting, Business Intelligence, Cognos Analytics, Financial Performance Management, TM1

Tips & Tricks: Installing Samples with Cognos Analytics

January 30, 2018 by Revelwood Leave a Comment

Tips & Tricks

This is a guest blog post by Revelwood’s Jay Apwah.

Did you know you there are many sample files available for Cognos Analytics? In order to better experience and understand new features in releases of Cognos Analytics, it is recommended that you install the sample databases, models, dashboards and reports.

Installing the samples involves the following four steps:

  1. Installing the samples
  2. Importing the sample content from its archive
  3. Restoring the sample databases from backups
  4. Creating data source connections in Cognos Analytics to the databases

In this blog, we will setup the Go Sales and Go Sales Warehouse samples and restore the databases into Microsoft SQL Server.

Prerequisites

  • Cognos Analytics 11.0.x is installed on Microsoft Windows
  • Cognos Analytics 11.0.x samples are downloaded from the IBM Passport Advantage site
  • SQL Server is installed

Installing the samples

  1. Run the installation for the sample content as administrator.
    Installing samples in Cognos Analytics_1Once installed, all the required files for the remaining steps will end up in a “samples” folder at the same level as your Cognos Analytics installation (if you installed Cognos Analytics with the default installation path). In the screenshot below, the “analytics” folder is where Cognos Analytics is installed by default. The samples will be installed in a separate folder called “samples”.Installing samples in Cognos Analytics_2
  2. In the samples folder, navigate to “\webcontent\samples\content”. You will find an archive called “IBM_Cognos_Samples.zip”. This archive contains the sample visualizations, reports, dashboards and filesInstalling samples in Cognos Analytics_4
  3. Copy that zip file and paste it into the “<Cognos Analytics install location>\deployment” folder.
    Installing samples in Cognos Analytics_4

Importing the sample content from its archive

  1. Login to Cognos Analytics and click the Manage button on the bottom left.Installing Samples in Cognos Analytics_5
  2. Click the option for Administration Console.Installing samples in Cognos Analytics_6
  3. In administration console, click the Configuration tab, then click Content Administration.
    Installing samples in Cognos Analytics_7
  4. On the right-hand side, click the New Import icon.
    Installing samples in Cognos Analytics_8
  5. Select the radio button next to the archive that you placed in the deployment folder. Then click Next > and proceed through the wizard to import the content (dashboards, reports and data files) into Cognos Analytics.
    Installing samples in Cognos Analytics_9
  6. You’ll know you have succeeded when you navigate to the Team Content folder and the samples appear.
    Installing samples in Cognos Analytics_10

Restoring the sample databases from backups

In this step, we will restore the GO Sales Data Warehouse database from a backup file into Microsoft SQL server.

  1. Login to SQL Server Management Studio.
  2. Right-click on Databases and select New Database…
    Installing samples in Cognos Analytics_11
  3. In the New Database wizard, type “GOSALESDW” in the Database name box and click OK.
    Installing samples in Cognos Analytics_12
  4. An empty database called GOSalesDW will appear in the list of databases.
    Installing samples in Cognos Analytics_13
  5. Right-click on Databases and select Restore Database…Installing samples in Cognos Analytics_14
  6. In the Restore Database wizard, select Device, then click the ellipses to the right (i.e., the three dots).
    Installing samples in Cognos Analytics_15
  7.  When asked to select backup devices, click Add
    Installing samples in Cognos Analytics_16
  8. When asked to locate the backup file, navigate to <samples install location>\webcontent\samples\datasources\sqlserver. Then select GOSALESDW.zip
    Installing samples in Cognos Analytics_17
  9. When asked to select backup devices, click on the GOSALESDW.zip path that you found in the previous step and click OK, then click OK again to restore the database.
    Installing samples in Cognos Analytics_18
  10. When you expand GOSALESDW > Tables, the list of restored tables will appear.
    Installing samples in Cognos Analytics_19

Creating data source connections in Cognos Analytics to the databases

In this step we will create a data source connection to the GOSALESDW database.

  1. Login to your Cognos Analytics environment.Installing samples in Cognos Analytics_20
  2. On the bottom left-hand side of the portal page, click the Manage icon, then click Data server connections.Installing samples in Cognos Analytics_21
  3. In the Data server connections pane, click the icon to Add new server.
    Installing samples in Cognos Analytics_22
  4. Since we restored the Microsoft SQL Server database, select Microsoft SQL Server from the Select a Type pane.Installing samples in Cognos Analytics_23
  5. We want to create a connection to the GOSALESDW database. Change the name of the new data server connection to “great_outdoors_warehouse”. Note: It is important to name the data source connection “great_outdoors_warehouse” so the sample reports can link back to the underlying database successfully.Note: When you want to create a connection to the GOSALES database, the data source connection should be named “great_outdoors_sales”.Installing samples in Cognos Analytics_24
  6. Enter the JDBC URL that the connection will use to connect to the GOSALESDW database. The format of the URL is as follows: Jdbc:sqlserver://<servername or IP>:<port>;DATABASE=GOSALESDW. The default SQL Server port is 1433.

    Installing samples in Cognos Analytics_25
  7. Select the radio button next to Use the following signon:, then click the icon to add a new sign-on.
    Installing samples in Cognos Analytics_26
  8. On the right, enter the credentials used to login to SQL Server Management Studio and access the GOSALESDW database.Installing samples in Cognos Analytics_27
  9. Save the connection information.Installing samples in Cognos Analytics_28
  10. Test the connection configuration.
    Installing samples in Cognos Analytics_29
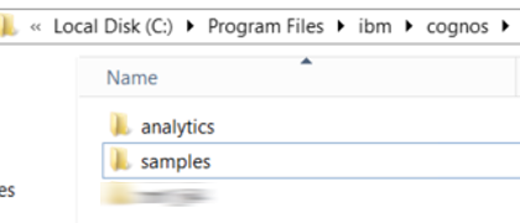
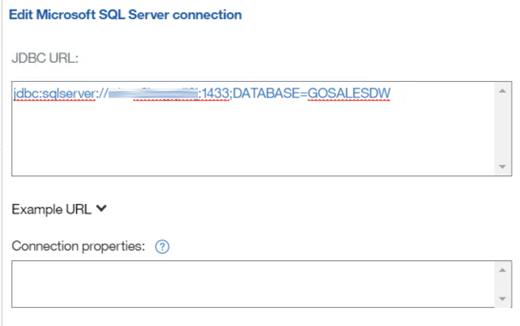
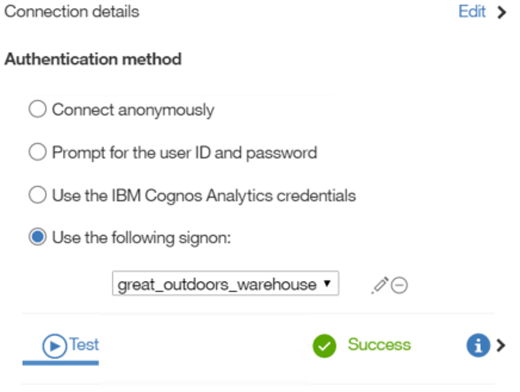
Note: If you receive driver-related errors when testing the connection, ensure that you have the sqljdbc42.jar file in <Cognos install location>\drivers. Move old versions of that driver to a safe location. You’ll have to restart the Cognos services for the addition of the new driver to take effect.
  11. To test that the data source connection to the GOSALESDW database was successful, run a sample report called “Sales managers” located in Team Content > Samples > Reports > Standard Reports.

Cognos Analytics is full of new features and functionality. Not sure where to start?  Our team here at Revelwood can help.  Contact us for more information at info@revelwood.com.  And stay tuned for more Tips & Tricks in our Knowledge Center and in upcoming newsletters!

Home » Business Intelligence

Filed Under: IBM Planning Analytics Tips & Tricks Tagged With: Business Intelligence, Cognos Analytics

Understanding Gartner’s Magic Quadrants for Analytics: An Expert’s Take, Part 3

October 6, 2016 by Cris Payne Leave a Comment

News & Events

In two recent blog posts (Gartner Magic Quadrants, Part 1 and Part 2), we provided some clarity around the various Magic Quadrants issued by Gartner in the analytics and business intelligence market. In this post we want to go a little deeper into two specific reports. Earlier this year, Gartner released its new 2016 Magic Quadrant for Advanced Analytics Platforms—the de facto reference standard for buyers evaluating advanced analytics packages. This report is not to be confused with their similarly named 2016 Magic Quadrant for Business Intelligence (BI) and Analytics Platforms report. While both analytic reports cover analytic technologies whose lines sometimes intersect and eventually may converge in the future, there still are very clear distinctions separating the two technology categories.

Further clarifying the differences between the two reports, Gartner defines advanced analytics as “the analysis of all kinds of data using sophisticated quantitative methods (such as statistics, descriptive and predictive data mining, machine learning, simulation and optimization) to produce insight that traditional approaches to business intelligence (BI)—such as query and reporting—are unlikely to discover.” There are also typically chronologic boundaries to what is produced in each analytic application: BI typically addresses data exploration and visualization of current or historical happenings, whereas advanced analytics, specifically predictive and prescriptive analytics using sophisticated algorithms, can pronounce future outcomes in terms of propensities or likelihoods—strong natural tendencies to occur, or predicted outcomes rooted in probability, respectively. In other words, BI is more rearview mirror looking, and advanced analytics looks forward.

This year’s Magic Quadrant for Advanced Analytics Platforms included:

  • 2 Challengers: SAP, Angoss
  • 5 Leaders: SAS, IBM, KNIME, RapidMiner, Dell
  • 5 Niche Players: FICO, Lavastorm, Megaputer, Prognoz, Accenture
  • 4 Visionaries: Alteryx, Predixion Software, Alpine Data

                                                         Source: Gartner (February 2016)


While Gartner evaluates these vendors on two specific dimensions—ability to execute and completeness of vision—and many of the niche players often address only specific use cases, the market research report underemphasizes how fully these vendors can accommodate a comprehensive analytic ecosystem. It does not specifically address how easy these vendors integrate with either their own complementary products, or with other third-party vendors.

As a consultant and a former leader of an advanced analytics department in a large industry environment, I can assure you that integration and deployment of advanced analytics are almost of parallel difficulty to the actual analytics being developed. How many of these vendors easily pair with analytic decision management offerings, master data management solutions, BI tools, visualization engines, Hadoop systems, marketing automation systems, etc.? These things are hidden behind the results.

An absence of disclosure on the specific vendor component scores makes it difficult to evaluate a true operational fit within an organization and within the analytic goals set forth by potential consumer.

So what does this mean for organizations?

Organizations must take into consideration what their larger goals are for their analytic programs. Consultants who have spent many years developing analytic solutions, both as industry practitioners and consultants, can often help organizations weed through the hype and get to the practical solutions that yield tangible results.

Revelwood has chosen to partner with IBM to develop innovative analytic solutions, not because they appear in the leader quadrant, but because they offer the most comprehensive analytic ecosystem to support an organization of any size. They also are putting more research and development than any other company—nearly $5.5 billion in the last 12 months alone.

I encourage any organization to utilize an analytics consultancy firm that has deep experience in developing solutions that produce results and can last in an enterprise environment.

Home » Business Intelligence

Filed Under: News & Events Tagged With: Analytics, Business Intelligence, Data Science, Financial Performance Management, Predictive Analytics

Understanding Gartner’s Magic Quadrants, Part 2

October 4, 2016 by Lisa Minneci Leave a Comment

News & Events

In a recent blog post we talked about Gartner’s view on the Corporate Performance Management market, and why they retired the Magic Quadrant for Corporate Performance Management Suites in favor of two magic quadrants. They are the Magic Quadrant for Financial Corporate Performance Management and the Magic Quadrant for Strategic Corporate Performance Management.

Our clients and our team have found a lot of valuable information in two additional magic quadrants from Gartner. The first is the Magic Quadrant for Advanced Analytics Platforms. This report, by Lisa Kart, Gareth Herschel, Alexander Linden and Jim Hare, defines advanced analytics as “the analysis of all kinds of data using sophisticated quantitative methods (such as statistics, descriptive and predictive data mining, machine learning, simulation and optimization) to produce insights that traditional approaches to business intelligence (BI) – such as query and reporting – are unlikely to discover.”

In some ways, analytics can seem like “all things to all people.” But in reality, different types of analytics are being used today by a wide range of organizations. And they are seeing tangible results from those analytic applications. In fact, Gartner reports that “by 2018, more than half of large organizations globally will compete using advanced analytics and proprietary algorithms, causing the disruption of entire industries.” Let that sink in a minute. In approximately two years, analytics will play such a strategic role in some organizations that it has the potential to disrupt entire industries. Whether you are working in a large organization, or in a mid-sized organization, now is the time to evaluate and assess what predictive analytics and advanced analytics can do for you.

The second Magic Quadrant in this space is the Magic Quadrant for Business Intelligence and Analytics Platforms by Josh Parenteau, Rita Sallam, Cindi Howson, Joao Tapadinhas, Kurt Schlegel, and Thomas Oestreich. In the report, Gartner outlines the shift in buying power for BI applications from IT to the business as a result of the evolution of self-service analytics. The authors write, “this significant shift has accelerated dramatically in recent years, and has finally reached a tipping point that requires a new perspective on the BI and analytics Magic Quadrant and the underlying BI platform definition – to better align with the rapidly evolving buyer and seller dynamics in this complex market.” The report also presents five use cases and 14 critical capabilities of a BI and analytics platform.

Clearly, there’s no lack of analysis available on vendors and solutions in the overall analytics space. In fact, just determining which Magic Quadrants are relevant for your project can be a challenge. We hope these posts provide some clarity and direction for you.

Home » Business Intelligence

Filed Under: News & Events Tagged With: Analytics, Business Intelligence, Data Science, Financial Performance Management, Predictive Analytics

Footer

Revelwood Overview

Revelwood helps finance organizations close, consolidate, plan, monitor and analyze business performance. As experts in solutions for the Office of Finance, we partner with best-in-breed software companies by applying best practices guidance and our pre-configured applications to help businesses achieve their full potential.

EXPERTISE

  • Workday Adaptive Planning
  • IBM Planning Analytics
  • BlackLine

ABOUT

  • Who We Are
  • What We Do
  • How We Help
  • How We Think
  • Privacy

CONNECT

Contact:

25B Vreeland Road, Suite 111 Florham Park, NJ 07932
201.984.3030
info@revelwood.com

Copyright © 2023 · Revelwood Inc. All rights reserved. Revelwood® and the Revelwood logo are registered marks of Revelwood Inc.