Did you know IBM Planning Analytics Workspace (PAW) allows you to create dynamic, attractive views and dashboards? With the vast number of stylistic options available, there are a few key tips that can be used to create a fluid user experience.
Use the “Caption” alias for dimension names.
The “Caption” alias can be modified for each dimension in the }DimensionAttributes cube. Once you’ve assigned a user-friendly name, or caption, to a dimension, this value will appear in your Planning Analytics Books in place of the dimension’s original name. The caption can then be updated at any point.
Use selector elements to ensure a uniform user experience.
Create selector elements when all users may not have access to all elements in the dimension. For instance, create an element in the department dimension called “Select a Department” and give everyone security to this new element. You can then set the new element as the starting point. When users open the dashboard, they will not see any data and will then be able to select elements based on their security rights.
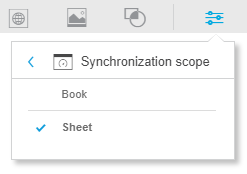
Synchronize dimensions throughout the Book and individual Sheets.
Once you’ve created a new Book, you can synchronize the data using the “Synchronization scope” option in the Properties dropdown. The Properties button is located in the upper right-hand corner of the screen when you are in edit mode (image below). You have the choice to synchronize across the Book or Sheet, meaning an element selection can be carried across multiple visualizations to allow for uninterrupted data access.
For more information on Planning Analytics Workspace, refer to the IBM Planning Analytics 2.0.0 documentation.
IBM Planning Analytics is full of new features and functionality. Not sure where to start? Our team here at Revelwood can help. Contact us for more information at info@revelwood.com. And stay tuned for more Planning Analytics Tips & Tricks weekly in our Knowledge Center and in upcoming newsletters!