You may already know that you can create a selector widget in IBM Planning Analytics Workspace (PAW) by simply dragging a context dimension outside your existing view. Once synchronized, this approach provides an easy way to create independent selectors that can be used with your existing PAW data pulls.
But what do you do in a situation when you have already hidden your exploration overview or converted your exploration into a chart? One approach is to reset the visualization into a fully expanded exploration, drag the dimension, and re-format the visualization. But did you know that an easier way exists?
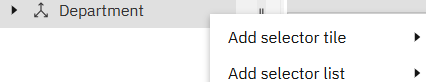
PAW version 99 introduced an option to add a selector directly from the data tree (e.g., the left pane). This can be accessed by simply right-clicking on a dimension in the tree. Once selected, there will be two options: add selector tile and add selector list.
There are three types of tiles: single tile, multiple tiles, and range selection tile. There are three types of lists: single list, multiple lists and multiple selection list.
Once created, the properties area will allow you to define appearance aspects such as colors, fonts, and header information.
This approach will allow you to create easy-to-use selectors without having to undo any existing formatting that has been created.
Revelwood is an IBM Gold Business Partner with 25+ years of experience designing, developing, implementing and maintaining IBM Planning Analytics environments. Revelwood has helped clients in all sizes across all industries optimize and grow their use of Planning Analytics. Revelwood’s Planning Analytics team consists of experienced PA experts, including a multi-year IBM Champion.
Stay up to date with PA – sign up for our weekly Planning Analytics Tips & Tricks newsletter, subscribe to our YouTube channel, and join our IBM Planning Analytics All-Stars group on LinkedIn.
Read more IBM Planning Analytics Tips & Tricks:
IBM Planning Analytics Tips & Tricks: PAW Thumb Cell Formatting
IBM Planning Analytics Tips & Tricks: PAW Exploration Icons
IBM Planning Analytics Tips & Tricks: High Availability in Version 12