• Skip to main content
  • Skip to footer
Revelwood Logo

Revelwood

Your SUPER-powered WP Engine Site

  • Who We Are
    • About Us
      • Our Company
      • Our Team
      • Partners
    • Careers
      • Join Our Team
  • What We Do
    • Solutions
      • Workday Adaptive Planning
      • IBM Planning Analytics
      • BlackLine
    • Services
      • Implementation Services
      • Customer Care
        • Help Desk
        • System Administration as a Service
      • Training
        • Workday Adaptive Planning Training
        • IBM Planning Analytics / TM1 Training
    • Products
      • DataMaestro
      • LightSpeed
      • IBM Planning Analytics Utilities
  • How We Help
    • Use Cases
    • Client Success Stories
  • How We Think
    • Knowledge Center
    • Events
    • News
  • Contact Us

PAW explorations

IBM Planning Analytics Tips & Tricks: PAW Exploration Icons

November 26, 2024 by Lee Lazarow

Have you ever been in a situation where you wanted your users to reference an exploration or chart on your IBM Planning Analytics Workspace (PAW) page, but you didn’t want to give them full access to make changes? You can do this by editing the toolbar to include or exclude icons.

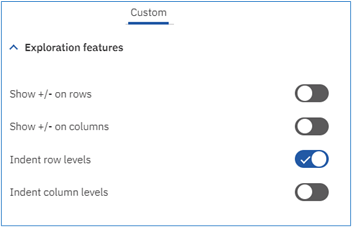
This setting is found within the Properties area within the Custom, Toolbar section. Here is a sample of the options for an exploration:

A screenshot of a computer

Description automatically generated

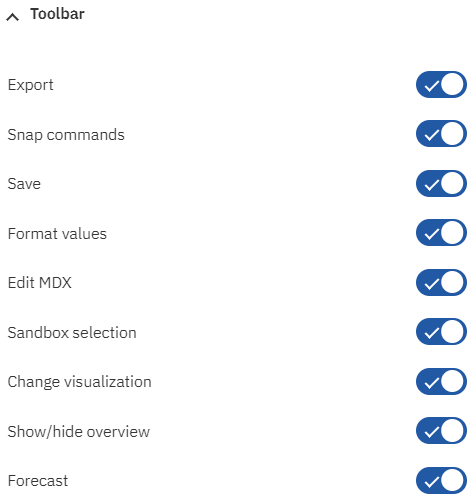
Not all icons are configurable (for example, the zero suppression icon will always be available to users), but each item in the list uses a simple on/off trigger to determine if the icons should appear for end users.

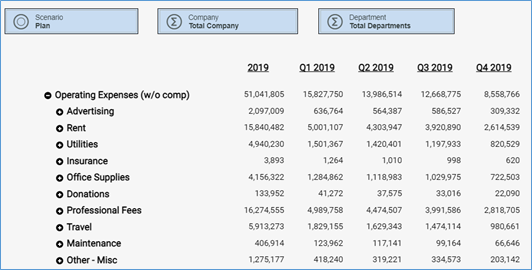
Here is an example with the “Edit MDX” icon enabled:

And here is an example with the “Edit MDX” icon disabled:

As you can see, disabled icons will completely disappear from the list.

This approach provides an easy way to simplify the ribbon for your end users.

Revelwood is an IBM Gold Business Partner with 25+ years of experience designing, developing, implementing and maintaining IBM Planning Analytics environments. Revelwood has helped clients in all sizes across all industries optimize and grow their use of Planning Analytics. Revelwood’s Planning Analytics team consists of experienced PA experts, including a multi-year IBM Champion.

Stay up to date with PA – sign up for our weekly Planning Analytics Tips & Tricks newsletter, subscribe to our YouTube channel, and join our IBM Planning Analytics All-Stars group on LinkedIn.

Read more IBM Planning Analytics Tips & Tricks

IBM Planning Analytics Tips & Tricks: High Availability in Version 12

IBM Planning Analytics Tips & Tricks: ASCIIOUTPUT

IBM Planning Analytics Tips & Tricks: Upcoming Changes to Planning Analytics

Home » PAW explorations

Filed Under: IBM Planning Analytics Tips & Tricks Tagged With: IBM, IBM Planning Analytics, PAW, PAW explorations, Planning Analytics Workspace

IBM Planning Analytics Tips & Tricks: PAW Explorations – Row & Column Headers

September 7, 2021 by Lee Lazarow Leave a Comment

Visualizations are used to provide an easy understanding of large data sets. After all, a picture is worth a thousand words. However, what happens when you want to see the intricate details of your numbers? This is where IBM Planning Analytics Workspace (PAW) explorations come into the picture.

There are many formatting options for your numbers, but what about the headers? Do you want to simply see a set of rows and columns or do you want the ability to expand into the details? Do you want to differentiate values at different levels or do you want to use consistent formatting? Do you want your row headers to be defined differently than your column headers?

PAW makes it easy to create your preferred approach via some simple settings. The settings are found within the Exploration features of the Custom area. Within the area, settings exist for each of the four settings.

IBM Planning Analytics - PAW Explorations

Here is an example of an exploration that differentiates accounts levels and allows for drilling down to the base level accounts but does not allow for any differentiation or drilling into the time periods.

IBM Planning Analytics: PAW Explorations

This flexibility allows you to define both the look and usage of your explorations, thereby enhancing (and hopefully simplifying) the end user experience.

IBM Planning Analytics, which TM1 is the engine for, is full of new features and functionality. Not sure where to start? Our team here at Revelwood can help. Contact us for more information at info@revelwood.com. And stay tuned for more Planning Analytics Tips & Tricks weekly in our Knowledge Center and in upcoming newsletters!

Read more IBM Planning Analytics Tips & Tricks:

IBM Planning Analytics Tips & Tricks: Columns and Sections of Stacked Columns

IBM Planning Analytics Tips & Tricks: PAW Lines vs Area for Multiple Elements

IBM Planning Analytics Tips & Tricks: Code Char

Home » PAW explorations

Filed Under: IBM Planning Analytics Tips & Tricks Tagged With: IBM Cognos TM1, IBM PAW, IBM Planning Analytics, IBM Planning Analytics Workspace, IBM Planning Analytics Workspace Explorations, PAW explorations

Footer

Revelwood Overview

Revelwood helps finance organizations close, consolidate, plan, monitor and analyze business performance. As experts in solutions for the Office of Finance, we partner with best-in-breed software companies by applying best practices guidance and our pre-configured applications to help businesses achieve their full potential.

EXPERTISE

  • Workday Adaptive Planning
  • IBM Planning Analytics
  • BlackLine

ABOUT

  • Who We Are
  • What We Do
  • How We Help
  • How We Think
  • Privacy

CONNECT

World Headquarters

Florham Park, NJ | 201 984 3030

European Headquarters

London & Edinburgh | +44 (0)131 240 3866

Latin America Office

Miami, FL | 201 987 4198

Email
info@revelwood.com

Copyright © 2025 · Revelwood Inc. All rights reserved. Revelwood® and the Revelwood logo are registered marks of Revelwood Inc.