Did you know it is best practice to maintain a hierarchy in Planning Analytics via TurboIntegrator (TI) process whenever possible? There are five key functions that can be used to do so.
HierarchyExists(DimName, HierName)
HierarchyExists is used to determine whether a specific hierarchy already exists on the server. The first parameter is the name of the dimension that contains the hierarchy to check, and the second parameter is the name of the hierarchy to check.
HierarchyCreate(DimName, HierName)
HierarchyCreate is used to create a new hierarchy in an existing dimension. The first parameter is the name of the dimension in which to create the hierarchy, and the second parameter is the name of the hierarchy to create.
HierarchyDeleteAllElements(DimName, HierName)
HierarchyDeleteAllElements deletes all elements from a hierarchy. The first parameter is the name of the dimension in which the hierarchy exists, and the second parameter is the name of the hierarchy from which to delete all elements.
HierarchyElementInsert(DimName, HierName, InsertionPoint, ElName, ElType)
HierarchyElementInsert adds an element to a hierarchy. The first and second parameters are once again used to specify the names of the applicable dimension and hierarchy (respectively). The third parameter can be used to specify the element before which the new element will be inserted. If it’s left blank, the new element will be inserted at the end of the dimension. The fourth parameter is the name of the new element, and the fifth parameter is the element type. The letter N signifies a numeric element, the letter S signifies a string element, and the letter C signifies a consolidated element.
HierarchyElementComponentAdd(DimName, HierName, ConsolidatedElName, ElName, ElWeight)
HierarchyElementComponentAdd adds a child to a consolidated element. The first and second parameters are once again used to specify the names of the applicable dimension and hierarchy (respectively). The third parameter is the name of the parent or consolidated element, the fourth parameter is the name of the child element, and the fifth parameter is the weight of the child element in the consolidation.
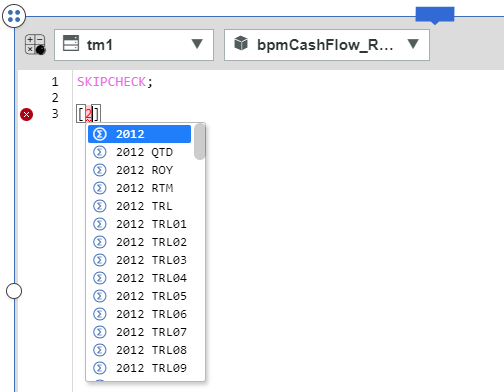
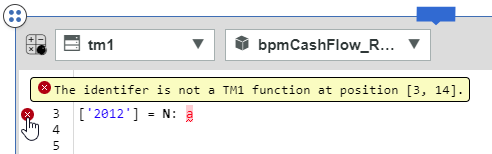
The following code example is used to create the Delivery Format hierarchy in the Publication dimension of this server. The metadata section of the code could then use attribute values or information from the data source to determine where in the hierarchy to place each base level publication.
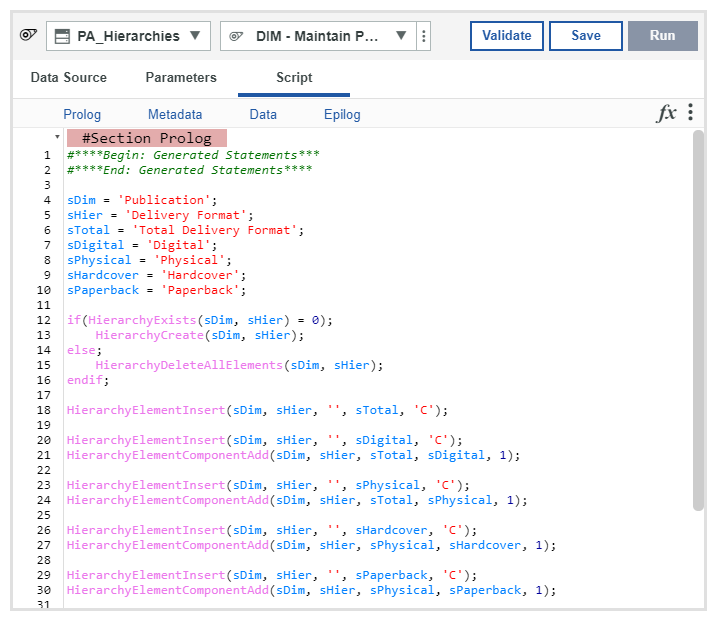
The full list of hierarchy manipulation TI functions can be found here.
IBM Planning Analytics, which TM1 is the engine for, is full of new features and functionality. Not sure where to start? Our team here at Revelwood can help. Contact us for more information at info@revelwood.com. And stay tuned for more Planning Analytics Tips & Tricks weekly in our Knowledge Center and in upcoming newsletters!
Read more blog posts in the IBM Planning Analytics Tips & Tricks Series:
IBM Planning Analytics Tips & Tricks: The Benefits of Using Hierarchies
IBM Planning Analytics Tips & Tricks: Workarounds for Unsupported Excel Functions in TM1 Web
IBM Planning Analytics Tips & Tricks: Recaclulating Excel Worksheets