This is a guest post from Revelwood’s Shane Bethea.
Did you know IBM Planning Analytics lets you make API calls through VBA in Planning Analytics for Microsoft Excel (PAx)? You probably know that action buttons can be used to refresh or rebuild reports in PAx. But what if you want to refresh the data in your report as part of a VBA routine? Maybe there are more tasks you want to perform through VBA and then you want to refresh the data as the last step. IBM offers the ability to make API calls through VBA in PAx with just a few steps.
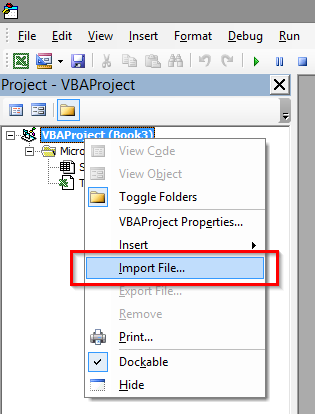
The first step is to open the Visual Basic editor in Excel and import two files (one module and one class module) that ship with your PAx installation. Do this in the VBA editor by right clicking on your workbook and selecting Import File.
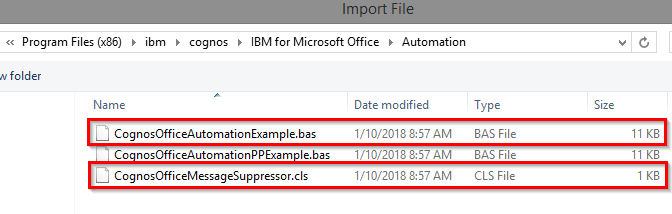
This opens an Import File dialogue box. Navigate to your PAx install location (either Program Files or Program Files (x86) ) and then navigate to \ibm\cognos\IBM for Microsoft Office\Automation\ .
You can then import two files: ‘CognosOfficeAutomationExample.bas’ and ‘CognosOfficeMessageSuppressor.cls’.
Once imported, you can use the public sub routines in the CognosOfficeAutomationExample module. This module includes some useful sub routines, such as:
- ClearAllData() – Functions the same as the Clear All Data toolbar/ribbon button to clear Explorations and reports from the workbook.
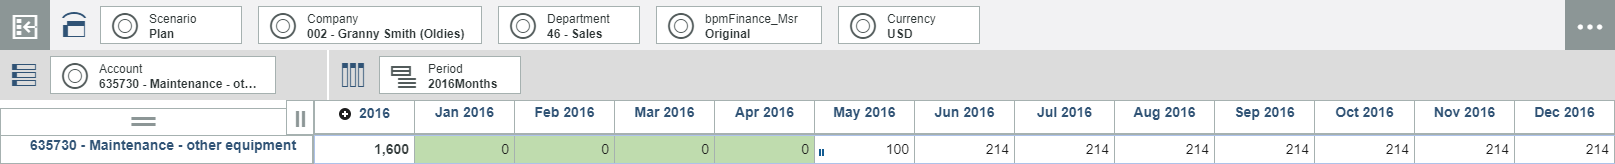
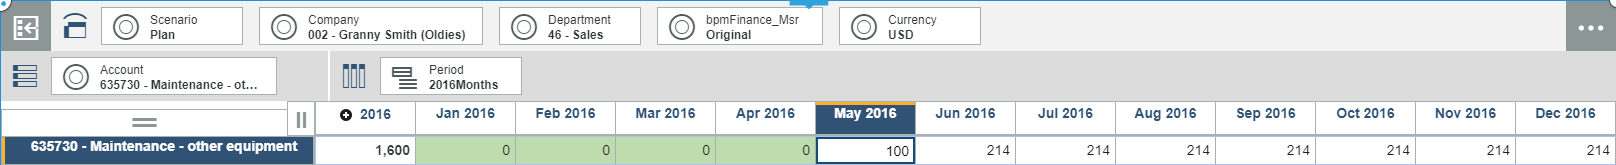
- RefreshAllData() – Functions the same as the Refresh All Data toolbar/ribbon button to refresh data for Explorations and reports in the workbook.
- RefreshAllDataAndFormat() – Functions the same as the Refresh All Data toolbar/ribbon button to refresh data and formats for Explorations and reports in the workbook.
- UnlinkAllData() – Functions the same as the Convert to Static toolbar/ribbon button to unlink all data in the workbook.
If you want to Refresh or Rebuild a Dynamic Report in PAx (formerly Active Forms in TM1 Perspectives), you have to get more creative. To accomplish this, follow the steps to import the two modules discussed earlier and then add the below code to the CognosOfficeAutomationExample module:
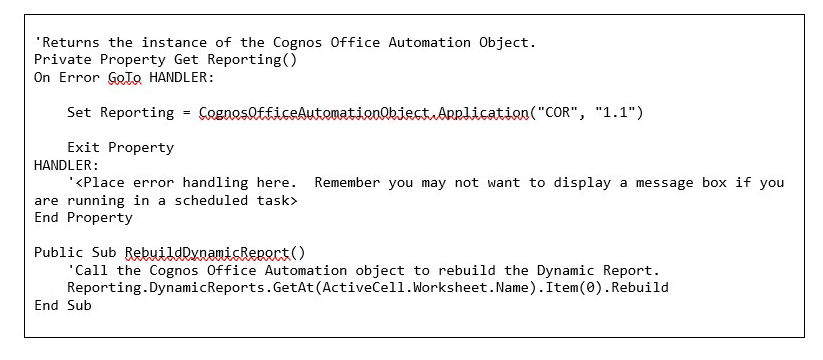
Now you can call the RebuildDynamicReport() sub routine from a Command Button or other VBA macro to rebuild your Dynamic Report.
IBM Planning Analytics is full of new features and functionality. Not sure where to start? Our team here at Revelwood can help. Contact us for more information at info@revelwood.com. And stay tuned for more Planning Analytics Tips & Tricks weekly in our Knowledge Center and in upcoming newsletters!