“A Processor Value Unit (PVU) is a unit of measure used to differentiate licensing of software on distributed processor technologies (defined by Processor Vendor, Brand, Type and Model Number). IBM continues to define a processor, for purposes of PVU-based licensing, to be each processor core on a chip (socket).”
So what does this mean in English? Basically, a PVU is unit of measure assigned to various hardware chips that allows IBM to assess a licensing cost for the power of that machine. As the hardware for your On-Premise IBM Planning Analytics systems become more powerful, the cost to license that power goes up. PVUs are licensed for both Production and Non Production (dev/ test) environments so it is important to ensure that you have both up to date.
Why is this important?
PVUs change as hardware changes thus making it important to stay up to date in order to remain compliant with license guidelines. If you bought 200 PVUs for your system 5 years ago, it’s a safe bet that there has been a hardware refresh at some point since then. If this created an increase in hardware power you must increase your PVUs to pass an IBM audit. For many clients, PVUs become the forgotten license.
It’s easy to understand users. If you add more people to the system then you know to add user licenses, but PVUs tend to be passed over. It’s important to stay informed so you remain compliant.
How do you know what is needed?
PVUs are calculated and displayed here : IBM PVU Chart
They are the result of an IBM calculation based on three things:
- The Chip family
- # of sockets
- # of cores
Example:
For this example, let’s assume that you have the following hardware makeup;
TEST TM1 – (1) socket, (2) Core Intel Xeon CPU E5-2670 v3 – Total 2 cores
PROD-1 TM1 – (4) socket, (2) Core Intel Xeon CPU E5-2670 v3 – Total 8 cores
PROD-2 TM1 – (2) socket, (2) Core Intel Xeon CPU E5-2670 v3 – Total 4 cores
Based on this info and the PVU table below:
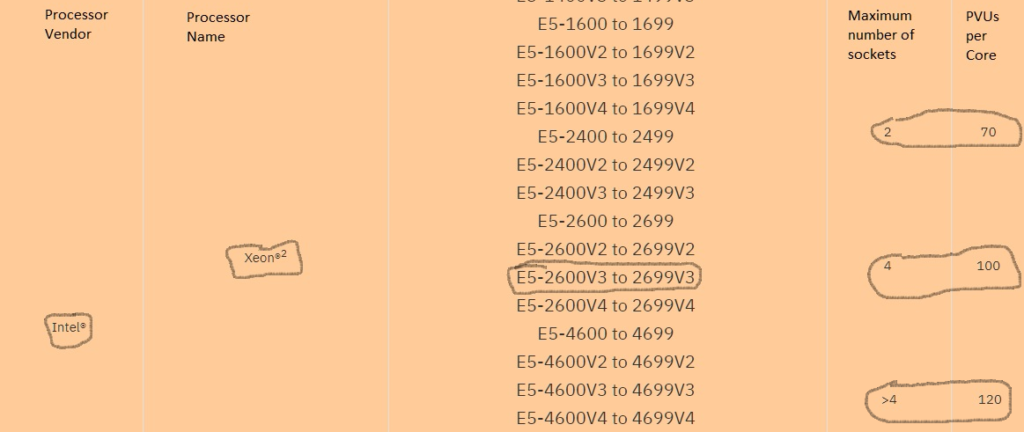
Test – 1 socket/2 cores = 70 PVUs per core or a total of 140 needed
Prod1 – 4 sockets/8 cores = 100 PVUs per core or a total of 800 needed
Prod2 – 2 sockets/4 cores = 70 PVUs per core or a total of 280 needed.
The total PVUs needed for Non Prod = 140
The total PVUs needed for Prod = 1080
PVUs are often an afterthought when thinking about licensing. It’s important to understand the need to maintain a current count in both your Prod and Non Prod environments or risk a large penalty if you are audited.