Did you know IBM Planning Analytics Workspace (PAW) gives you many options for showing data in charts? Here are some tips and tricks for working with charts in PAW.
A scatter chart is used to show relationships within your data. This type of chart is great to see patterns and groupings over a large set of values. A bubble chart is also used to show relationships and it is also great to see patterns. So what is the difference between the two types of charts?
In this blog post, we explain the difference between the two types of charts. As you’ll learn, the type of chart makes a difference when reviewing your data. How to decide which chart to use? It’s simple – ask yourself how many details you want to see at once.
PAW includes various visualizations that can be used to view your data. One of these visualizations entails a chart called a waterfall chart. This type of chart will help you show the components of a summarized number. It is very helpful in determining which values are beneficial to the total and which values are detrimental.
This blog post shows an exploration in PAW and its corresponding waterfall chart.
Lines vs Area for Multiple Elements
A line chart is typically used to show values over time. This type of chart is great to see trends with your data. An area chart is also used to show values over time and is sometimes referenced as a line chart with the area below the line filled. While this is the case in PAW for a chart that contains a single line, it is not the case for a chart with multiple lines.
Read this blog post to learn about a line chart versus an area chart.
IBM Planning Analytics, which TM1 is the engine for, is full of new features and functionality. Not sure where to start? Our team here at Revelwood can help. Contact us for more information at info@revelwood.com. And stay tuned for more Planning Analytics Tips & Tricks weekly in our Knowledge Center and in upcoming newsletters!
Read more IBM Planning Analytics Tips & Tricks:
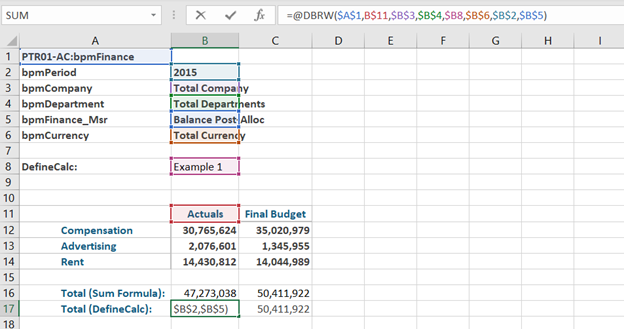
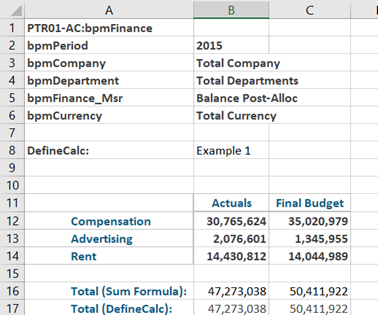
IBM Planning Analytics Tips & Tricks: DefineCalc
IBM Planning Analytics Tips & Tricks: Top 3 Blog Posts of 2022
IBM Planning Analytics Tips & Tricks: 2022’s Top 3 Tips & Tricks Videos