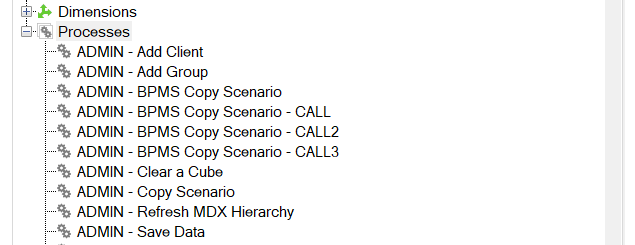
Did you know that you can run TurboIntegrator (TI) processes via the task pane in Planning Analytics for Excel (Pax)? Within the task pane, you can choose to display processes by clicking on the “Show and Hide” button and selecting the option to “Show processes.”
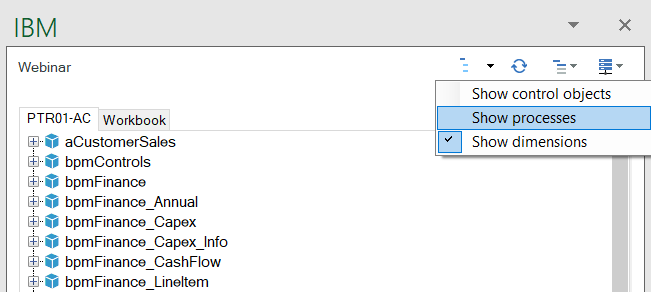
Once enabled, the processes will appear at the bottom of the task pane.
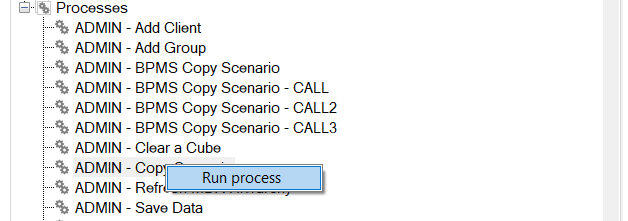
You can run the scripts by right-clicking on a process and selecting the option to “Run process.”
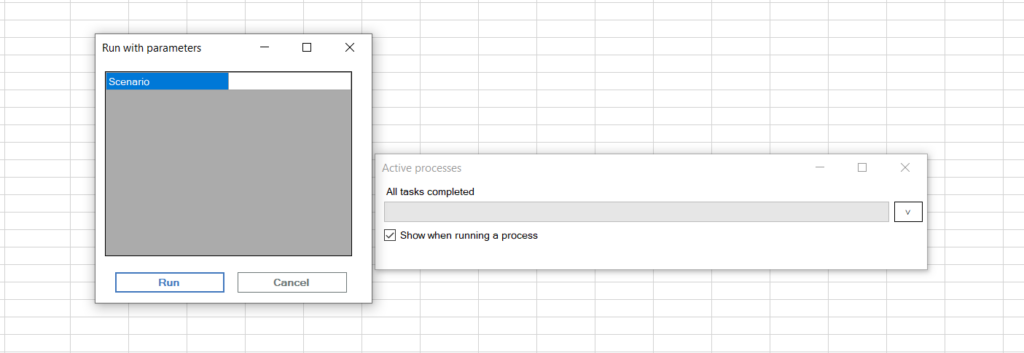
If any parameters are needed, a popup box will appear.
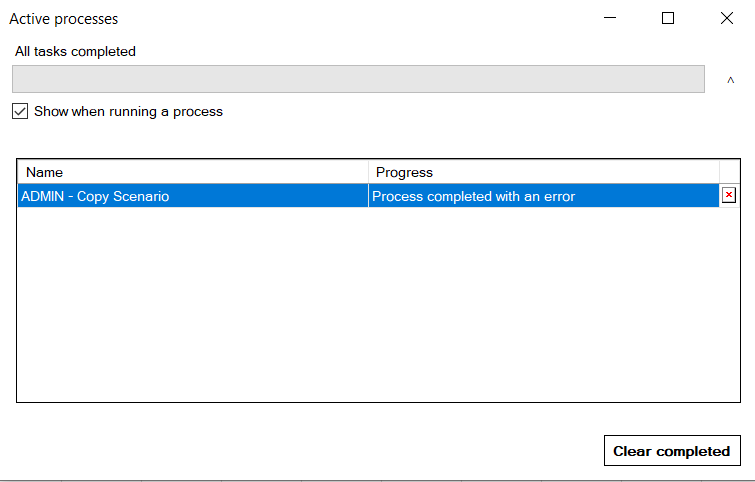
After the process has completed, you can expand the details by hitting the drop-down symbol on the right. This will summarize whether the process ran successfully or whether there were any errors. You can then get further details about the error(s) via the message log.
IBM Planning Analytics, which TM1 is the engine for, is full of new features and functionality. Not sure where to start? Our team here at Revelwood can help. Contact us for more information at info@revelwood.com. And stay tuned for more Planning Analytics Tips & Tricks weekly in our Knowledge Center and in upcoming newsletters!
Read more IBM Planning Analytics Tips & Tricks:
IBM Planning Analytics Tips & Tricks: UNIQUE Function in Excel
IBM Planning Analytics Tips & Tricks: On-Demand Webinars, Part 2
IBM Planning Analytics Tips and Tricks: Upgrading to Planning Analytics for Excel 2.0.65 or later