• Skip to main content
  • Skip to footer
Revelwood Logo

Revelwood

Your SUPER-powered WP Engine Site

  • Who We Are
    • About Us
      • Our Company
      • Our Team
      • Partners
    • Careers
      • Join Our Team
  • What We Do
    • Solutions
      • Workday Adaptive Planning
      • IBM Planning Analytics
      • BlackLine
    • Services
      • Implementation Services
      • Customer Care
        • Help Desk
        • System Administration as a Service
      • Training
        • Workday Adaptive Planning Training
        • IBM Planning Analytics / TM1 Training
    • Products
      • DataMaestro
      • LightSpeed
      • IBM Planning Analytics Utilities
  • How We Help
    • Use Cases
    • Client Success Stories
  • How We Think
    • Knowledge Center
    • Events
    • News
  • Contact Us

IBM Planning Analytics Workspace charts

IBM Planning Analytics Tips & Tricks: PAW Lines vs Area for Multiple Elements

August 10, 2021 by Lee Lazarow Leave a Comment

Tips & Tricks

A line chart is typically used to show values over time. This type of chart is great to see trends with your data. An area chart is also used to show values over time and is sometimes referenced as a line chart with the area below the line filled. While this is the case in IBM Planning Analytics Workspace (PAW) for a chart that contains a single line, it is not the case for a chart with multiple lines.

Here is a simple line chart in PAW and the related area chart:

IBM Planning Analytics Tips & Tricks: PAW Line vs Area for Multiple Elements

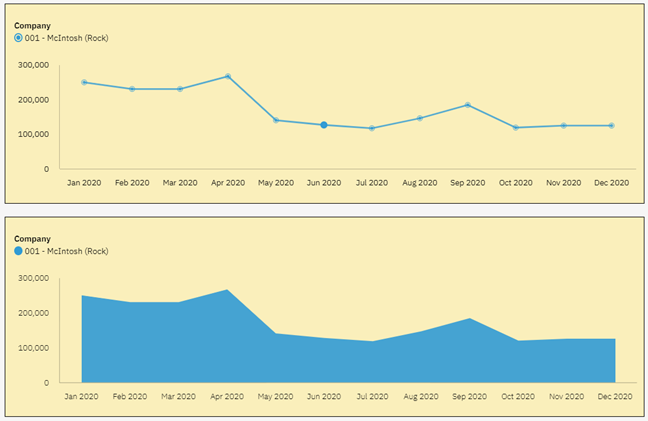
In both situations, you can see the trend and you can also see the values.

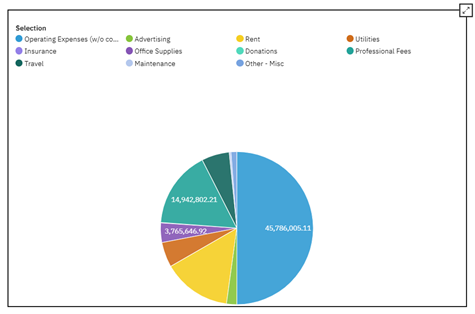
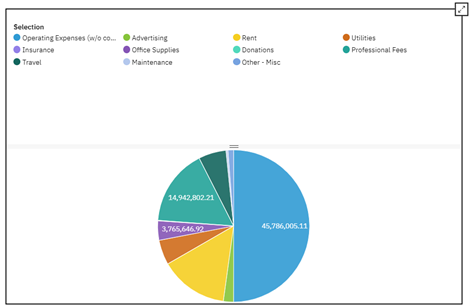
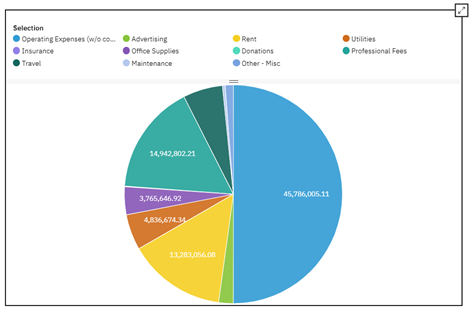
Here are the same PAW charts with multiple lines (e.g., multiple companies):

IBM Planning Analytics Tips & Tricks: PAW Line vs Area for Multiple Elements

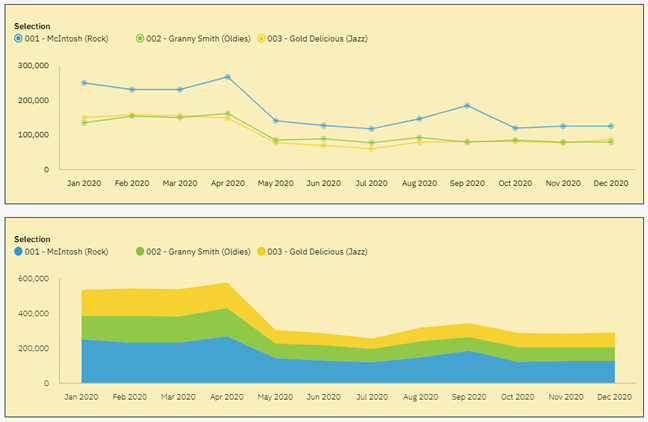
In both situations you can again see the trends in the data by looking at the flows from left to right. However, you do not see the same values in the two reports. You can see this by looking at the labels on the Y-axis. The line chart is designed to show a set of independent values and therefore allows you to see the values for each company. The area chart is designed to show the accumulation of the values, which makes it hard to determine values for anything except for the bottom element.

As you can see, the type of chart makes a difference when reviewing your data. So how do you decide which chart to use? The simple answer is to ask yourself what you are looking to see. Are you looking for separate values or accumulated values? As long as your picture answers that question, you can never go wrong!

IBM Planning Analytics, powered by TM1, is full of new features and functionality. Need advice? Our team here at Revelwood can help. Contact us for more information at info@revelwood.com. We post new Planning Analytics Tips & Tricks weekly in our Knowledge Center and in newsletters.

Read more IBM Planning Analytics Tips & Tricks:

IBM Planning Analytics Tips & Tricks: Scatter Charts vs Bubble Charts

IBM Planning Analytics Tips & Tricks: The Waterfall Chart

IBM Planning Analytics Tips & Tricks: PAW Chart Padding

Home » IBM Planning Analytics Workspace charts

Filed Under: IBM Planning Analytics Tips & Tricks Tagged With: charts, enterprise performance management, enterprise planning, Financial Performance Management, IBM Planning Analytics, IBM Planning Analytics Workspace, IBM Planning Analytics Workspace charts

IBM Planning Analytics Tips & Tricks: Pie Chart Sizing

June 22, 2021 by Lee Lazarow Leave a Comment

Tips & Tricks

Did you know that IBM Planning Analytics Workspace (PAW) allows you to “split” your pie chart widget to define how much of the space is allocated to the legend and how much of the space is allocated to the chart? 

While in edit mode, you can view and modify the split by moving your mouse over the widget. You will then see a bar appear that can be used to resize the split.

Here is an example of a chart with a legend:

Pie Chart Sizing in IBM Planning Analytics

Here is the same chart with my mouse hovering in the legend area of the widget:

IBM Planning Analytics Tips: Pie Chart Sizing

And here is the result of dragging the bar up:

IBM Planning Analytics Tricks: Pie Chart Sizing

You can see that the chart is now larger since less area was allocated to the legend.

Interested in learning more about charts and graphs in IBM Planning Analytics Workspace? Watch our webinar, “Best Practices When Using IBM Planning Analytics Workspace Charts.”

IBM Planning Analytics, powered by TM1, is full of new features and functionality. Need advice? Our team here at Revelwood can help. Contact us for more information at info@revelwood.com. We post new Planning Analytics Tips & Tricks weekly in our Knowledge Center and in newsletters.

Read more IBM Planning Analytics Tips & Tricks:

IBM Planning Analytics Tips & Tricks: Planning Analytics Workspace (PAW) Tab Icons

IBM Planning Analytics Tips & Tricks: Planning Analytics Workspace (PAW) Tab Colors

IBM Planning Analytics Tips & Tricks: Planning Analytics Workspace (PAW) Gridlines

Home » IBM Planning Analytics Workspace charts

Filed Under: IBM Planning Analytics Tips & Tricks Tagged With: enterprise performance management, enterprise planning, IBM Cognos TM1, IBM PAW, IBM Planning Analytics, IBM Planning Analytics charts, IBM Planning Analytics graphs, IBM Planning Analytics Workspace, IBM Planning Analytics Workspace charts, IBM Planning Analytics Workspace graphs, TM1 administration

Footer

Revelwood Overview

Revelwood helps finance organizations close, consolidate, plan, monitor and analyze business performance. As experts in solutions for the Office of Finance, we partner with best-in-breed software companies by applying best practices guidance and our pre-configured applications to help businesses achieve their full potential.

EXPERTISE

  • Workday Adaptive Planning
  • IBM Planning Analytics
  • BlackLine

ABOUT

  • Who We Are
  • What We Do
  • How We Help
  • How We Think
  • Privacy

CONNECT

World Headquarters

Florham Park, NJ | 201 984 3030

European Headquarters

London & Edinburgh | +44 (0)131 240 3866

Latin America Office

Miami, FL | 201 987 4198

Email
info@revelwood.com

Copyright © 2025 · Revelwood Inc. All rights reserved. Revelwood® and the Revelwood logo are registered marks of Revelwood Inc.