• Skip to main content
  • Skip to footer
Revelwood Logo

Revelwood

Your SUPER-powered WP Engine Site

  • Who We Are
    • About Us
      • Our Company
      • Our Team
      • Partners
    • Careers
      • Join Our Team
  • What We Do
    • Solutions
      • Workday Adaptive Planning
      • IBM Planning Analytics
      • BlackLine
    • Services
      • Implementation Services
      • Customer Care
        • Help Desk
        • System Administration as a Service
      • Training
        • Adaptive Planning Training
        • IBM Planning Analytics / TM1 Training
    • Products
      • DataMaestro
      • LightSpeed
      • IBM Planning Analytics Utilities
  • How We Help
    • Workday Adaptive Planning Use Cases
    • IBM Planning Analytics Use Cases
    • BlackLine Use Cases
    • Client Success Stories
  • How We Think
    • Knowledge Center
    • Events
    • News
  • Contact Us

enterprise performance management

Workday Adaptive Planning Tips & Tricks: Utilizing Split Rows in Modeled Sheets

August 3, 2022 by Dillon Rossman Leave a Comment

Do you know how to utilize splits in Workday Adaptive Planning for a modeled sheet? Splits allow you to have multiple lines as part of one record and you can set splits on a column-by-column basis. 

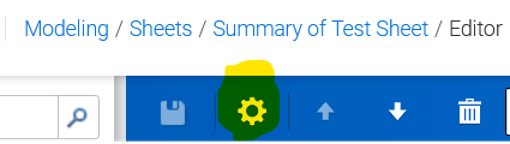
A use case might be a personnel model in which you want the ability to allocate a single employee to multiple departments. To turn on splits, navigate to the settings of your modeled sheet and click “Columns and Levels.”

Graphical user interface, application

Description automatically generated

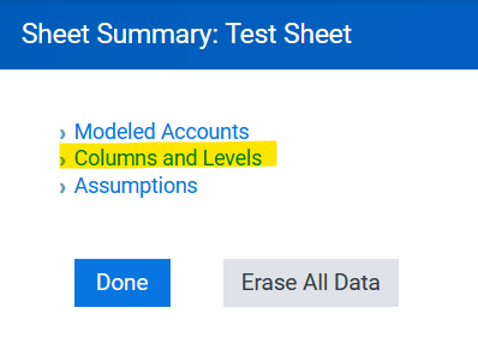
From here, click on the “Sheet Properties” button

Application

Description automatically generated with medium confidence

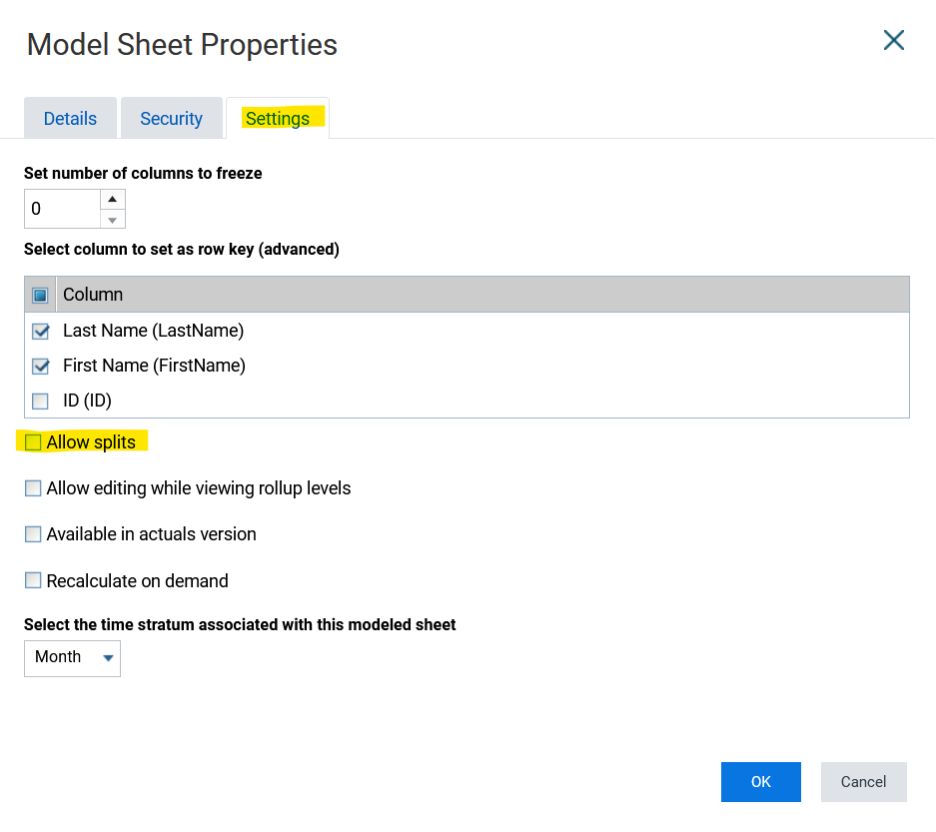
Within the pop-up menu, click on “Settings” then enable “Allow Splits” and hit “OK”

Graphical user interface, text, application

Description automatically generated

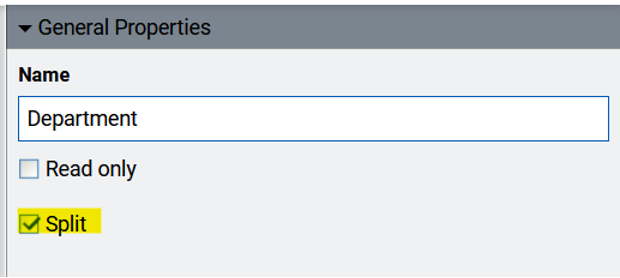
Once this is completed, you will notice each column now has a checkbox for “Split.” In this example we will turn this on for the “Department” and “Allocation” columns.

Graphical user interface, application

Description automatically generated

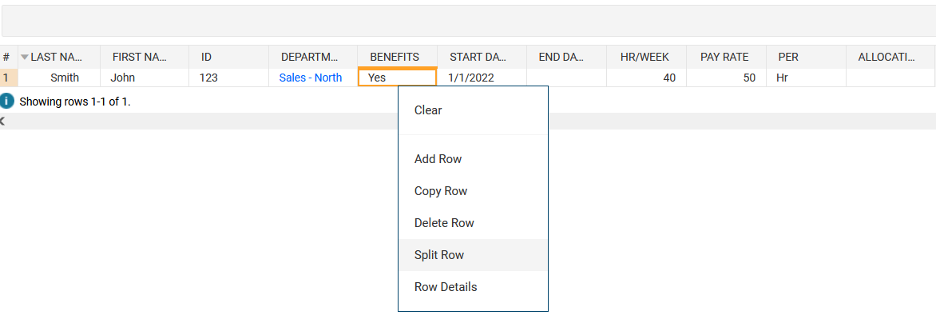
Within our sheet we have an existing row for John Smith. In order to create split rows we just have to right-click on John Smith’s row and select “Split Row.” 

Graphical user interface, text

Description automatically generated
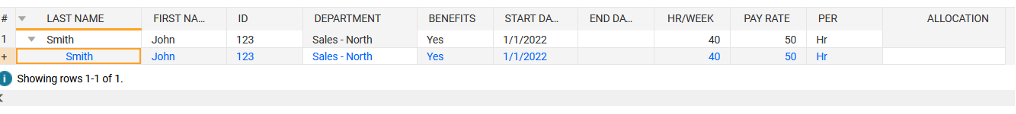
Once the split row is added you will see that only the two columns we designated with splits are split. The information from the consolidated row gets carried down to the split rows for the non-split columns.

In this example I will create two split rows. I’d like to allocate John Smith to two departments. After adding a second two split row, updating the information, and saving the sheet, you will now see two split rows that are each allocated 50% to their department and a consolidated row that totals up to a 100% allocation.

You could have accomplished the same end result with multiple independent rows, however, splits provide several benefits including:

  • Non-split columns will automatically copy the consolidated row data to the split rows.
  • Split rows are grouped together.
  • Groupings show the summations of split column values, in this example you can see the allocation percentages add up to 100%. Independent rows would not clearly show you an employee is allocated 100%.

Visit Revelwood’s Knowledge Center for our Workday Adaptive Planning Tips & Tricks or sign up here to get our Workday Adaptive Planning Tips & Tricks delivered directly to your inbox. Not sure where to start with Workday Adaptive Planning? Our team here at Revelwood can help! Contact us info@revelwood.com for more information.

Read more Workday Adaptive Planning Tips & Tricks:

Workday Adaptive Planning Tips & Tricks: Check Boxes in Modeled Sheets

Workday Adaptive Planning Tips & Tricks: Show Actuals for Linked Accounts

Workday Adaptive Planning Tips & Tricks: Override Formulas

Home » enterprise performance management

Filed Under: Workday Adaptive Planning Tips & Tricks Tagged With: enterprise performance management, Financial Performance Management, Planning & Forecasting, Workday Adaptive Planning, Workday Adaptive Planning Tips & Tricks

IBM Planning Analytics Tips & Tricks: Excel DELET Function

July 26, 2022 by Lee Lazarow Leave a Comment

A while back I wrote a blog about the SCAN function which showed how you can search for specific characters and then combine this with the SUBST formula to create new sets of text. But what if you wanted an easier way to simply skip some characters within the string? This can be done with the DELET function.

The DELET function is used to delete a set of characters from within a string. The syntax of the command is: 

DELET (string, start, number)

  • String = the source text string
  • Start = the character where deletion will begin
  • Number = the number of characters to delete

For example: 

DELETE (‘phone’, 2, 3) returns ‘pe’

This function can be used to perform tasks such as removing dashes in between an element code number and name or removing a prefix from a list of elements. This will simplify your code by allowing you to simply ignore some text instead of merging two substrings together.

Revelwood has worked with IBM Planning Analytics / TM1 for more than 27 years. We’ve partnered with hundreds of companies on the design, development, maintenance and updates of IBM Planning Analytics applications, across every industry. Have a challenge with Planning Analytics / TM1? We can help you!

Read More IBM Planning Analytics Tips & Tricks:

IBM Planning Analytics Tips & Tricks: Using Charts and Data Series with Dynamic Reports

IBM Planning Analytics Tips & Tricks: Stacked Rows in PAx

IBM Planning Analytics Tips & Tricks: PASS Version Numbering

Home » enterprise performance management

Filed Under: IBM Planning Analytics Tips & Tricks Tagged With: Budgeting Planning & Forecasting, enterprise performance management, Financial Performance Management, IBM Cognos TM1, IBM Planning Analytics, TM1

Workday Adaptive Planning Tips & Tricks: Data Integration and the Excel Spreadsheet Data Source

July 20, 2022 by Marc Assenza Leave a Comment

Did you know that Workday Adaptive Planning can use Microsoft Excel Workbooks as Data Sources for Data Integration?

It’s true! The process is surprisingly simple if a few basic rules and steps are followed:

  1. Your column names, positions, and formatting should remain consistent once you decide upon the layout. In the example below, Period, Value, Account and Level will always be in the same order with the same consistent formatting on a moving forward basis.
Table

Description automatically generated
  1. The name of your worksheet within the workbook will need to remain the same. Within the Workday Adaptive integration, the worksheet name becomes the table name in the Design Integrations task pane. As a side note, if you have multiple worksheets as part of a workbook, each worksheet becomes an available table to use for that spreadsheet data source. See screenshot below:
Table, Excel

Description automatically generated
  1. ALL row and column values must be exactly that, values. There cannot be any formulas or summed totals on the spreadsheet
  1. Import your Spreadsheet data source through the easy-to-use Actions Pane link named “Import Spreadsheet.”

.Graphical user interface, text, application, chat or text message

Description automatically generated

  1. Follow the automated prompting.
Graphical user interface, text, application, email

Description automatically generated
  1. Ensure your workbook was uploaded by viewing it in the Data Sources data pane.
Graphical user interface, text, application, chat or text message

Description automatically generated
  1. Open your Data Source and locate your table from the Data Components Pane.
Text

Description automatically generated
  1. Drag your table into the Staging area to review and query the data.
Graphical user interface, text, application

Description automatically generated

That’s all it takes to import an Excel Workbook as an Excel Spreadsheet Data Source. Be on the lookout for more Workday Adaptive Data Integration tips and tricks from me in the future!

Visit Revelwood’s Knowledge Center for our Workday Adaptive Planning Tips & Tricks or sign up here to get our Workday Adaptive Planning Tips & Tricks delivered directly to your inbox. Not sure where to start with Workday Adaptive Planning? Our team here at Revelwood can help! Contact us info@revelwood.com for more information.

Read more Workday Adaptive Planning Tips & Tricks:

Workday Adaptive Planning Tips & Tricks: How to Remove Repetitive Total Rows

Workday Adaptive Planning Tips & Tricks: General Ledger Root Accounts

Adaptive Insights Tips & Tricks: Overriding the Level Security on Matrix Reports

Home » enterprise performance management

Filed Under: Workday Adaptive Planning Tips & Tricks Tagged With: Budgeting Planning & Forecasting, enterprise performance management, Financial Performance Management, Workday Adaptive Planning, Workday Adaptive Planning Tips & Tricks

IBM Planning Analytics Tips & Tricks: PAW Chart Show Totals

July 19, 2022 by Dillon Rossman Leave a Comment

Tips & Tricks

One of IBM Planning Analytics’ purposes is to serve as an aggregation tool. As a result, many of your explorations consist of a series of base level elements plus a total. Here is an example of a simple exploration that shows details of a list of companies plus a total:

Table

Description automatically generated

This exploration can easily be converted into a pie chart by simply changing the visualization to a pie chart. Here is what the pie chart will look like:

Chart, pie chart

Description automatically generated

However, the concept of aggregations has now shifted into a detriment since the total will always appear as 50% of the chart! Planning Analytics Workspace (PAW) allows you to hide the totals by defining properties within each field of your chart. You can do this via the following steps:

  1. While in Edit mode, single click on your pie chart widget.
  1. Select the option for “Fields” at the top, right corner. Not all visualizations use fields, so this may appear blank if you have not yet converted your widget to a pie chart.
  1. Click the three vertical dots associated with the dimension that should not include totals. In my example, the segment is associated with the company dimension.
  1. Select the option to Hide Totals.

Once selected, the same pie chart will look like this:

Chart, pie chart

Description automatically generated

This approach will allow you to properly define when you want a total to appear, thereby making your chart results beneficial to the user.

Revelwood has worked with IBM Planning Analytics / TM1 for more than 27 years. We’ve partnered with hundreds of companies on the design, development, maintenance and updates of IBM Planning Analytics applications, across every industry. Have a challenge with Planning Analytics / TM1? We can help you!

Read more IBM Planning Analytics Tips & Tricks:

IBM Planning Analytics Tips & Tricks: Displaying Percentages on a Planning Analytics Workspace (PAW) Pie Chart

IBM Planning Analytics Tips & Tricks: PAW Pie Percent or Value?

IBM Planning Analytics Tips & Tricks: PAW Explorations – Row & Column Headers

Home » enterprise performance management

Filed Under: IBM Planning Analytics Tips & Tricks Tagged With: enterprise performance management, Financial Performance Management, IBM Cognos TM1, IBM Planning Analytics, Planning Analytics Tips & Tricks, TM1

Modern Accounting: 6 Essential Qualities for Surviving the Robot Uprising in Accounting

July 14, 2022 by Revelwood Leave a Comment

This is a guest blog post from our partner BlackLine, explaining how you could be more productive with fewer resources, less overtime, and also easily improve the quality of your work.

As accounting and finance professionals, you do so much more than just handle money matters—you’re also critical for creating strategy and driving process improvements across the entire organization.

But if the majority of your days are spent manually reconciling accounts and matching transactions, little time is left for these bigger picture activities.

What if you could be more productive with fewer resources, less overtime, and also easily improve the quality of your work? Not only would you be pleased with this improvement, but it would set you apart in the industry.

Optimizing Your F&A People

Your accounting and finance professionals are at the heart of your organization’s innovation, and crucial to driving strategy and future business growth. But according to a recent BlackLine survey conducted by Censuswide, many mid-sized and large company decision-makers are not fully leveraging this talent.

Manual processes and tedious tasks take up too much time and result in this invaluable skillset being widely underutilized. To unlock the value of your people, begin by automating the manual accounting work that consumes so much of accountants’ time and effort.

When manual processes are automated, accounting and finance teams spend fewer hours on transactional activities. The focus shifts to analyzing the data and reports, and addressing only the exceptions.

This enables everyday accountants to become exceptional accountants, providing high-value services in areas like fraud detection, compliance, data analytics, technology, and business advice.

What Is an Exceptional Accountant?

When you are only researching the anomalies, you can finally refocus on providing strategic guidance to the business, such as improving internal processes or finding cost-saving opportunities. In other words, the added time allows you to apply not just your knowledge and expertise, but your nuanced creativity and intelligence as well.

According to Helen Brand, chief executive of the Association of Chartered Certified Accountants (ACCA), “To succeed as a professional accountant…a vastly different set of skills is required than was necessary just 10 short years ago. And in the next decade, things are likely to change even faster and more dramatically as the global economy continues to evolve at an ever-quickening pace.”

So, what does the exceptional accountant of tomorrow need to cultivate today? Think mastering communication, not macros. Strategic aptitude, instead of being spreadsheet savvy.

In short, capabilities that enable you to deliver predictive insights to leadership, drive data-based decisions and provide expert counsel. 

6 Skills You Need to Become an Exceptional Accountant

These six skills needed for accounting work in unison to serve as building blocks to exceptional accountant status.

1. Analytical Skills

For the finance function, providing leadership with historical data used to be quite sufficient. Yet today, companies also expect to have access to predictive data.

For today’s accountants, this requires knowing how to turn Big Data into concise, decision-driving insights. Vanguard businesses are already hiring accountant/data scientists. Accountants looking toward the future must have both a theoretical and practical understanding of data and analytics.

2. Communication Skills

It’s said ad nauseam: it’s the Age of Information. Yet all this information is just noise if it’s not shared effectively. The exceptional accountant of tomorrow won’t just know why data looks like it does (analytical skills); she’ll also be able to skillfully convey those insights to others.

Accountants must begin to cultivate strong written communication skills: the ability to think critically and translate those thoughts into compelling documents. They will also need strong oral communication skills: the ability to convey pertinent financial information to executive teams and stakeholders.

3. Relationship Skills

During the “good ole days,” an accountant could hide in the back office, subsisting on a few basic greetings at the legendary water cooler.

Yet thriving in tomorrow’s business is going to take more than water cooler-level conversational skills. As automation streamlines transactional tasks, accountants won’t have the “millions of transactions to match” excuse to sidestep human interaction.

The exceptional accountant of the future will know how to manage numbers and people. That requires cultivating a broader range of relationship skills today, such as how to work in a team, how to motivate and engage employees, and how to deliver bad news — without making somebody cry.

4. Creativity

It used to be that nobody wanted a “creative” accountant. But in an era when businesses must quickly identify opportunities while simultaneously mitigating risk, a finance professional who can think outside of the proverbial box is a strategic asset.

Accountants who can combine creativity with a deep understanding of the company’s financial capabilities will be able to solve complex financial—and non-financial—problems faster and more cost-effectively.

5. Business Acumen

Contributing to the business on a strategic level requires more than just an understanding of the numbers. Accountants also need to understand the business as a whole. The ability to provide counsel to the C-suite requires seeing the big picture, from how each functional area works to the best way to acquire and retain talent.

When accountants have the opportunity for stretch assignments, cross-training, and job-sharing, it’s easier to understand—and make decisions based upon—the holistic interplay between a company’s services, employees, customers, and stakeholders.

6. Tech Savvy

Technology isn’t just changing every job function; technology itselfchanges rapidly. Instead of expecting to use the same tool for the next decade, accountants today must be ready to use new technology every year. This requires not just a basic understanding of technology itself, but the ongoing cultivation of flexibility andadaptability.

Benefits of Developing Your F&A Professionals

Today more than ever, companies need finance and accounting professionals who can transcend traditional number crunching. Yet for accountants, making the transition from spreadsheet jockey to strategic expert requires new skills.

Your people are the ones who redesign your processes, and therefore it is essential to encourage, help develop, and hire for a different set of skills needed for accounting. This is the most difficult hurdle to clear because there is so much inertia, with the biggest battle being the comfortable, fixed mindset of “this is the way it’s always been done.”

The tactic to overcoming this is to create buy-in for the Continuous Accounting approach and get your people on board with your vision. For this to be successful, your Continuous Accounting strategy must clearly point to your end goal as an organization, along with a blueprint of achievable milestones.

Fundamentally, Continuous Accounting is a story about unleashing the accounting and finance professionals who have unparalleled vision to experiment, push the limits, try and fail. When you allow your people to drive change, they deliver things that scale in a very exciting way.

And it all begins with empowering your teams with the skills needed for Accounting to propel the entire organization into the future.

Accountants who cultivate business acumen can begin to provide guidance relevant to the entire company, not just the finance department.

Nurturing creativity leads to innovative solutions for some of the biggest challenges in business today, from the unexpected corner of accounting.

Developing analytical capabilities ensures the accounting function can deliver true insight, not just historical information, while building communication and relationship skills guarantee those insights aren’t lost in translation.

Finally, because technology will continue to change at light speed, accountants who not only have basic IT skills but also flexibility and adaptability will always be ready to integrate new, more efficient tools into existing processes.

Read more Modern Accounting blogs:

Modern Accounting: Changing the Culture in Accounts Receivable

Auto-Certification Rules for Balance Sheet Reconciliations in BlackLine

Workflow Capabilities for Balance Sheet Reconciliations in BlackLine

Home » enterprise performance management

Filed Under: Financial Close & Consolidation Tagged With: BlackLine, enterprise performance management, Financial Performance Management, modern accounting

IBM Planning Analytics Tips & Tricks: Excel MAXIFS and MINIFS

July 12, 2022 by Lee Lazarow Leave a Comment

Many of you know that Excel’s MAX function will define the largest value within a range. And many of you also know that Excel’s SUMIFS function will allow you to merge IF checks into your sum formulas. But did you know that Excel has a function called MAXIFS which merges these two concepts together?

The MAXIFS function is used to determine the largest number within a range that satisfies one or more conditions.

The syntax of the function is:

=MAXIFS (max_range, criteria_range1, criteria1 [,criteria_range2, criteria2] [..])

  • Max_range
    • This is required
    • This defines the range to search
  • Criteria_range1
    • This is required
    • This defines the range to perform the IF check
  • Criteria1
    • This is required
    • This defines the criteria of the IF check
  • Criteria_range2 and Criteria2
    • These are optional
    • These allow you to have multiple IF checks
    • You can have more than 2 criteria

The following example shows how to define the maximum value for Lee.  

Other iterations of this formula include MINIFS, AVERAGEIFS and COUNTIFS.

Revelwood has worked with IBM Planning Analytics / TM1 for more than 27 years. We’ve partnered with hundreds of companies on the design, development, maintenance and updates of IBM Planning Analytics applications, across every industry. Have a challenge with Planning Analytics / TM1? We can help you!

Read more IBM Planning Analytics Tips & Tricks:

IBM Planning Analytics Tips & Tricks: Unhide Multiple Excel Sheets

IBM Planning Analytics Tips & Tricks: Refresh PAW Visualizations Automatically

IBM Planning Analytics Tips & Tricks: Improve Workbook Performance

Home » enterprise performance management

Filed Under: IBM Planning Analytics Tips & Tricks Tagged With: enterprise performance management, IBM Cognos TM1, IBM Planning Analytics, Planning & Forecasting, Planning Analytics Tips & Tricks, TM1

Workday Adaptive Planning Tips & Tricks: Loan Amortization

July 6, 2022 by Robert Nordhagen Leave a Comment

Loan amortization schedules in Workday Adaptive Planning are slightly different than those done in Excel.

In Excel the typical amortization schedule looks like this:

In Workday Adaptive Planning most versions only go 1-5 years into the future. Creating a complete 10-25 year amortization schedule is not the best practice. Here is an example of an Amortization Schedule in Adaptive:

A picture containing table

Description automatically generated

In Adaptive we show inputs in rows 2-8. Rows 10 through 14 are the formulas that calculate the interest per period, the principle and the declining principal balance.  

Row 2: Input the initial loan balance for every month the loan will be active. If you are keying it in, as opposed to uploading a file from Excel, you can use Copy Forward rather than key it in every month.  

Row 3: Input Balance (if acquiring the loan). Instead of the initial balance, put the balance as of assumption date.

Row 4: Principal Payment. This is used for variable rate loans 

Row 5: The months will be the same just like the Initial Balance for every month that the loan is active.  

Row 6: Amort Month is a counter that increases by 1 each month until the loan matures, then the field should go blank. In most cases the version will max out before the loan matures.

Row 7: Interest Rate %. This will be the same every month for fixed rate loans. For variable rate, forecast the expected rate by month.

Row 8: Draw Down. This is for additional payments.  

The formula rows will calculate as follows:

Row 10: Beginning balance is equal to prior month ending balance.

Row 11: Total Payment. This is the most complicated formula and takes many scenarios into account using nested ifs. The basis of the formula is the payment formula; ie, Balance x i / ( (1+i) * (1- 1/( 1+I )^n ))

Row 12:  Interest Payment. This takes the Beginning Balance * the Interest rate (monthly rate: rate/12)

Row 13:  Principal Payment. This takes Total Payment – Interest Payment

Row 14:  Ending Balance. This takes the Beginning Balance – Principal Payment – Draw Down

Follow up to Amortization is Conversion to Straight Line

Previously, we showed how to do a loan amortization in Adaptive Planning. Now we will go to the next step: Straight-line the interest according to GAAP in certain situations. Below is a loan amortization that takes the loan payments to maturity. The interest payments are summed. That sum is then divided evenly among the payments and the amortization schedule is redone with constant interest every month as shown in the second schedule.

This is tricky in Adaptive Planning because a typical Excel schedule is run out to term since there are almost always sufficient columns in an Excel sheet to handle all the monthly payments. However, in Adaptive Planning, a typical version will be only 3 to 5 years into the future so only loans within 60 months of maturity could follow the same pattern. 

For any longer maturities we have to apply the following logic. For loans with a constant monthly payment (which is most loans), calculate the payment. Then multiply the payment by the number of payments such as $9541.10 * 120 months, which is equal to $1,144,932.00 (slightly different by $0.37 due to rounding). Subtract the initial balance $1,144,932 – $1,000,000 = $144,932 which is the total of the interest. Now the Interest Payment will be equal to the total interest divided by the number of payments as seen below.

Table

Description automatically generated

Now the GL account for Interest Expense can be linked to SL_Interest_Pmt and the GAAP reporting of Straight Line interest will be in the P&L.

Visit Revelwood’s Knowledge Center for our Workday Adaptive Planning Tips & Tricks or sign up here to get our Workday Adaptive Planning Tips & Tricks delivered directly to your inbox. Not sure where to start with Workday Adaptive Planning? Our team here at Revelwood can help! Contact us info@revelwood.com for more information.

Read more Workday Adaptive Planning Tips & Tricks:

Workday Adaptive Planning Tips & Tricks: Save Personal Views on Sheets with Dashboard

Workday Adaptive Planning Tips & Tricks: Excel Substitute

Workday Adaptive Planning Tips & Tricks: Interactive Dashboards – Dynamic Planning with Embedded Sheets

Home » enterprise performance management

Filed Under: Workday Adaptive Planning Tips & Tricks Tagged With: Adaptive Planning, Budgeting, enterprise performance management, Planning & Forecasting, Workday Adaptive Planning, Workday Adaptive Planning Tips & Tricks

IBM Planning Analytics Tips & Tricks: PAW Escape Character

July 5, 2022 by Tara Byrnes Leave a Comment

Have you ever been in a situation where you have an element name with an apostrophe (or two) in IBM Planning Analytics? Examples of this might entail last names such as “O’Connor” or “O’Sullivan”?  

Although IBM best practices specify that the apostrophe is a special character to avoid in object and element names, in many instances you’ll see an apostrophe used in your data source (especially in names and brand names).

Planning Analytics confuses the apostrophe as a single quote … which is a special character used to define literal strings. You can resolve this situation by using an “escape character.” An escape character invokes an alternative interpretation on the characters which follow.

The Planning Analytics escape character sequence defines 2 single quotes together as the equivalent of 1 single quote. 

Example:

‘O’’Connor’ will display as ‘O’Connor’  

This escape sequence can be used in both Rules and Turbo Integrator processes.  

This approach will allow your use of O’Connor to properly work instead of causing you to convert it into “oh darn”!

Revelwood has worked with IBM Planning Analytics / TM1 for more than 27 years. We’ve partnered with hundreds of companies on the design, development, maintenance and updates of IBM Planning Analytics applications, across every industry. Have a challenge with Planning Analytics / TM1? We can help you!

Read more IBM Planning Analytics Tips & Tricks:

IBM Planning Analytics Tips & Tricks: Excel’s XMATCH Function

IBM Planning Analytics Tips & Tricks: Adding a New Entry to Index Cube via Dynamic Report

IBM Planning Analytics Tips & Tricks: Excel Workbook Stats

Home » enterprise performance management

Filed Under: IBM Planning Analytics Tips & Tricks Tagged With: Budgeting Planning & Forecasting, enterprise performance management, Financial Performance Management, IBM Cognos TM1, IBM Planning Analytics, TM1

IBM Planning Analytics Tips & Tricks: Excel CubeDimensionCountGet Function

June 21, 2022 by Lee Lazarow Leave a Comment

Have you ever written a TurboIntegrator process and needed to know how many dimensions are in a specific cube? Maybe you want to loop through each dimension to create a zero out view. You can do this by using the TABDIM function and searching for the first blank result, or you can simply use the CubeDimensionCountGet function.

The syntax of the function is: 

CubeDimensionCountGet (CubeName)

This function will result in a numeric value that tells the number of dimensions within the cube.

Other uses of this code will allow you to define the number of arguments needed for a CELLPUT command, compare the number of dimensions between multiple cubes, or replicate an existing cube.

This approach will simplify your code by eliminating the need to create a loop.  

Revelwood has worked with IBM Planning Analytics / TM1 for more than 27 years. We’ve partnered with hundreds of companies on the design, development, maintenance and updates of IBM Planning Analytics applications, across every industry. Have a challenge with Planning Analytics / TM1? We can help you!

Read more IBM Planning Analytics Tips & Tricks:

IBM Planning Analytics Tips & Tricks: Excel OFFSET Function

IBM Planning Analytics Tips & Tricks: PAx – Rebuild Book vs Recreate Book

IBM Planning Analytics Tips & Tricks: Updating ODBC Connections for Multiple Processes

Home » enterprise performance management

Filed Under: IBM Planning Analytics Tips & Tricks Tagged With: enterprise performance management, Financial Performance Management, IBM Cognos TM1, IBM Planning Analytics, Planning Analytics Tips & Tricks, TM1

  • Go to page 1
  • Go to page 2
  • Go to page 3
  • Interim pages omitted …
  • Go to page 8
  • Go to Next Page »

Footer

Revelwood Overview

Revelwood helps finance organizations close, consolidate, plan, monitor and analyze business performance. As experts in solutions for the Office of Finance, we partner with best-in-breed software companies by applying best practices guidance and our pre-configured applications to help businesses achieve their full potential.

EXPERTISE

  • Workday Adaptive Planning
  • IBM Planning Analytics
  • BlackLine

ABOUT

  • Who We Are
  • What We Do
  • How We Help
  • How We Think
  • Privacy

CONNECT

Contact:

25B Vreeland Road, Suite 111 Florham Park, NJ 07932
201.984.3030
info@revelwood.com

Copyright © 2023 · Revelwood Inc. All rights reserved. Revelwood® and the Revelwood logo are registered marks of Revelwood Inc.