BPM Partners’ BPM Pulse Survey is in its 16th year, and yet again Revelwood partners Adaptive Insights and IBM have both earned high ratings in the annual survey of business performance management vendors.
General Trends in the Business Performance Management Market
According to Craig Schiff of BPM Partners, the survey revealed that users of performance management systems are primarily looking for three main features when they evaluate BPM solutions:
- Ease of use;
- Performance and scalability; and
- A single user interface for budget owners outside of finance.
Additionally, Schiff mentioned that users strongly prefer vendors who have integrations with existing systems.
This year’s survey revealed a very interesting key trend: the “rebirth” of dashboards. Users reported that they’ve added dashboards on to most projects, that dashboards are used to deliver analytics, that they have a desire for interactive, drillable dashboards, and that in some cases they have multiple dashboards throughout a solution for specific use cases.
The BPM Pulse survey also found that users have a focus on granular profitability analysis. That focus, however, is different based on industry. Currently the pre-packaged options are limited. It also creates system challenges around volume and performance.
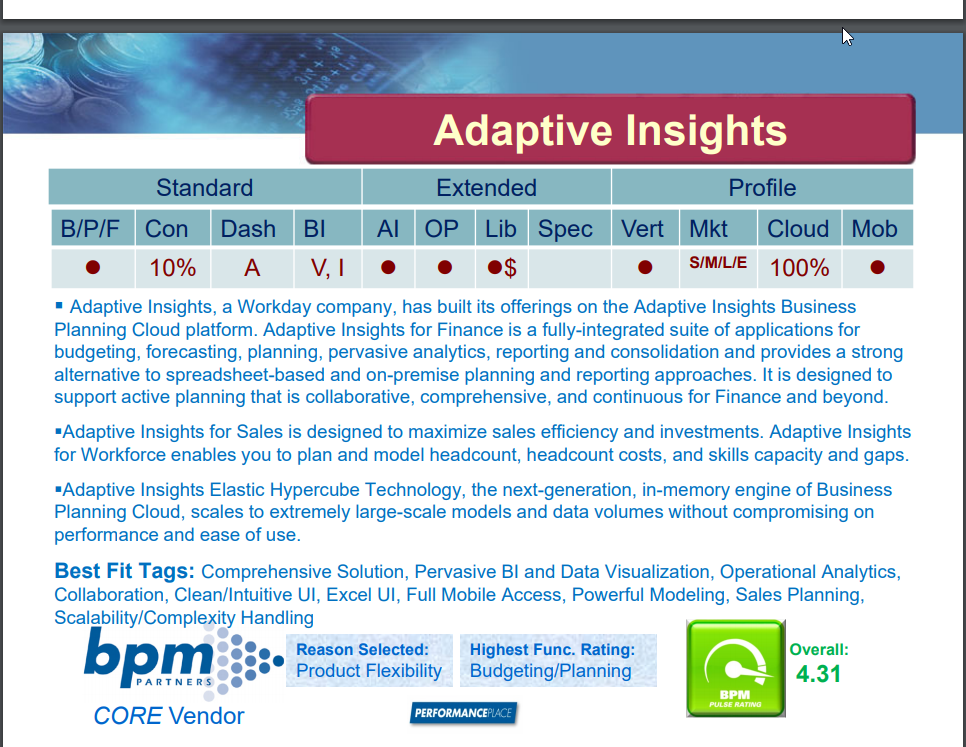
Adaptive Insights’ Rating in the BPM Pulse Survey
Adaptive was named a top-rated vendor in 2019 for the key category of budgeting/planning functionality. The company had an overall score of 4.31 (out of 5) and was cited for its extended market reach, AI capabilities and anomaly detection. Adaptive Insights was also recognized for its comprehensive solution, integrations, data visualization, operational analytics, collaboration, and clean/intuitive user interface. The survey found that Adaptive Insights was most often selected for its product flexibility. Its highest functional rating in the BPM Pulse survey was for budgeting/planning.
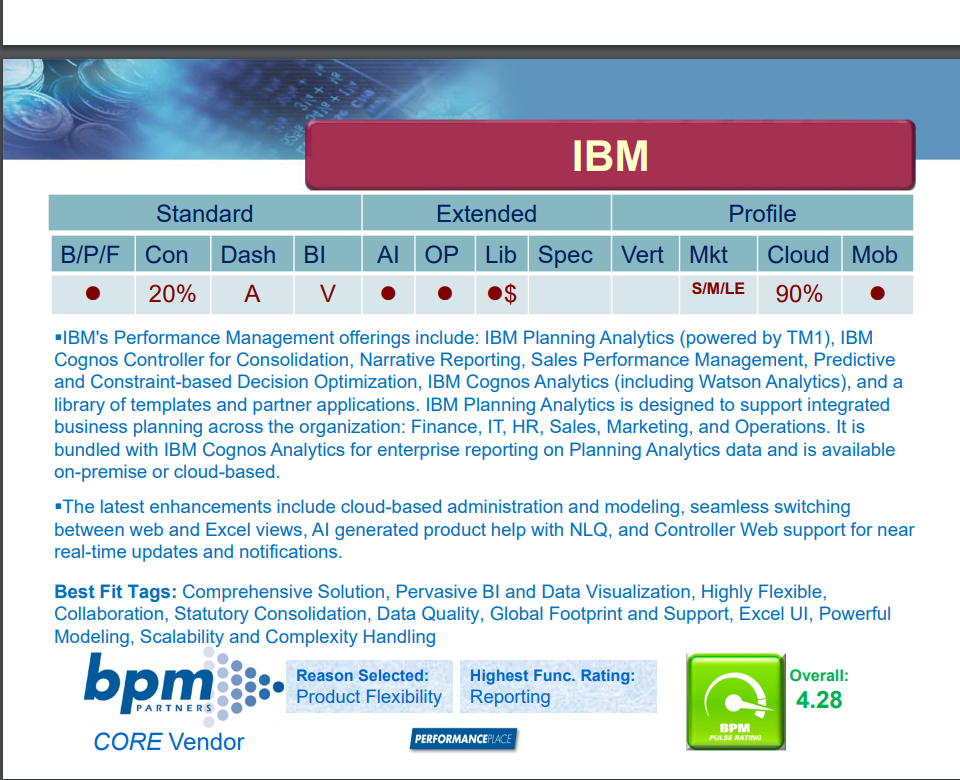
IBM’s Rating in the BPM Pulse Survey
IBM was named a top-rated vendor for Planning Analytics’ budgeting/planning functionality as well. The company had an overall score of 4.28. The webinar for the BPM Pulse Survey cited the company’s business performance management offerings’ latest enhancements as including “cloud-based administration and modeling, seamless switching between web and Excel views, and more. Users selected Planning Analytics for its product flexibility and its highest functional rating in the BPM Pulse survey was for reporting.
Watch BPM Partners’ webinar – in conjunction with Industry Week – here.