In our latest IBM Planning Analytics Tips & Tricks video, Revelwood’s FP&A Technical Director, Lee Lazarow explains and demonstrates how bookmarks work in IBM Planning Analytics Workspace (PAW). Bookmarks in PAW are quick and easy to use and make a big difference when navigating through many items in Planning Analytics.
Watch Bookmarking in IBM Planning Analytics and learn:
- How to add or remove a bookmark
- How bookmarks are used to quickly move to a certain spot
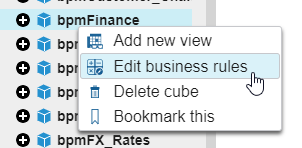
- How bookmarks are used to go to a specific view
IBM Planning Analytics, which TM1 is the engine for, is full of new features and functionality. Not sure where to start? Our team here at Revelwood can help. Contact us for more information at info@revelwood.com. And stay tuned for more Planning Analytics Tips & Tricks weekly in our Knowledge Center and in upcoming newsletters!
Watch other videos in our IBM Planning Analytics Tips & Tricks series:
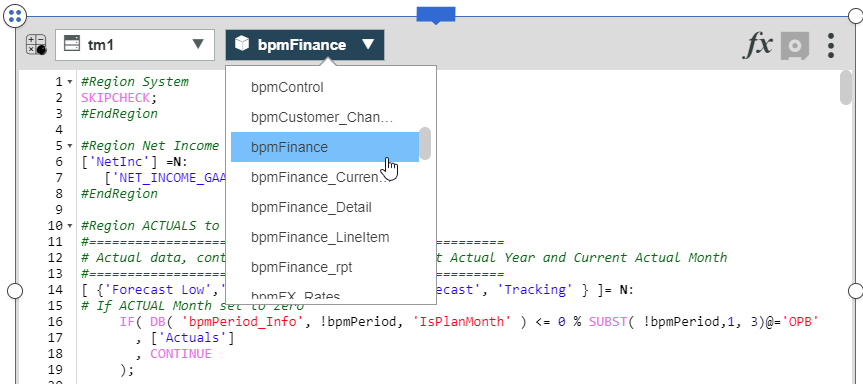
Regions with Rules in IBM Planning Analytics
Creating Dimensions in IBM Planning Analytics