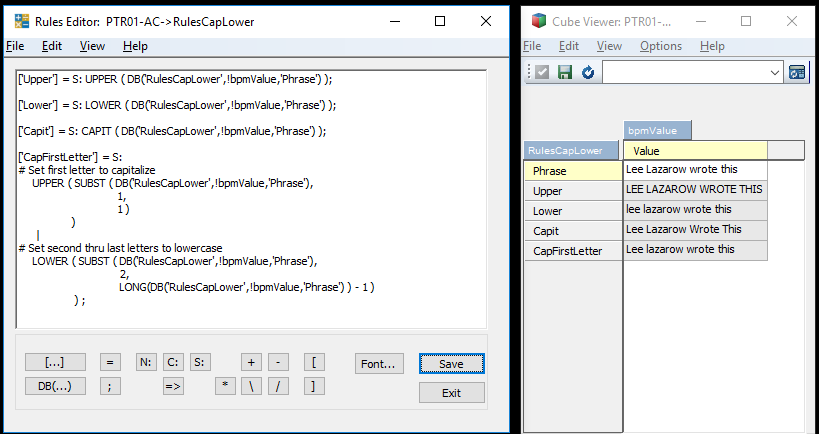
• Skip to main content
  • Skip to footer
Revelwood Logo

Revelwood

Your SUPER-powered WP Engine Site

  • Who We Are
    • About Us
      • Our Company
      • Our Team
      • Partners
    • Careers
      • Join Our Team
  • What We Do
    • Solutions
      • Workday Adaptive Planning
      • IBM Planning Analytics
      • BlackLine
    • Services
      • Implementation Services
      • Customer Care
        • Help Desk
        • System Administration as a Service
      • Training
        • Workday Adaptive Planning Training
        • IBM Planning Analytics / TM1 Training
    • Products
      • DataMaestro
      • LightSpeed
      • IBM Planning Analytics Utilities
  • How We Help
    • Use Cases
    • Client Success Stories
  • How We Think
    • Knowledge Center
    • Events
    • News
  • Contact Us

Planning & Reporting

IBM Planning Analytics Tips & Tricks: PA Modeling – The Settings Editor

April 16, 2019 by Revelwood Leave a Comment

Tips & Tricks

This is a guest post from Revelwood’s Shane Bethea.

Did you know that there is a new way to edit object settings in IBM Planning Analytics Workspace (PAW)? The Settings editor is new for PAW and gives the system administrator a clear, easy to use interface to modify attributes, security, and properties for objects such as cubes, dimensions, processes, and chores (where applicable). In the background, the Settings editor is still modifying entries in control cubes such as the }CubeAttributes, }CubeSecurity, and }CubeProperties cubes, but the new interface is much easier to use and a more centralized interface.

To use the Settings editor, right click on Cubes (or Dimensions, Processes, or Chores) within the navigation tree and select Edit settings.

IBM Planning Analytics Tips & Tricks: The Settings Editor

Selections to edit Attributes, Security, or Properties are in the top, right hand corner of the Settings editor that appears. Each interface is displayed below.

IBM Planning Analytics Tips & Tricks: Understanding the Settings Editor
IBM Planning Analytics Tips & Tricks: How to use the Settings Editor
IBM Planning Analytics Tips & Tricks: Learn how to use the Settings Editor

You can easily switch between Cube, Dimension, Process, and Chore settings by changing the value in the drop down list at the top left corner of the Settings editor.

IBM Planning Analytics Tips & Tricks: The Settings Editor in Planning Analytics Workspace

The grid below outlines the different cubes that are modified by the Settings editor.

Understanding the Settings Editor in Planning Analytics Workspace

The new Settings editor widget simplifies your administrative tasks by giving you a single approach to modify many different components within your Planning Analytics environment. Stay tuned for more entries covering the other modeling widgets.

IBM Planning Analytics is full of new features and functionality. Not sure where to start? Our team here at Revelwood can help. Contact us for more information at info@revelwood.com. And stay tuned for more Planning Analytics Tips & Tricks weekly in our Knowledge Center and in upcoming newsletters!

Learn more IBM Planning Analytics Tips & Tricks:

IBM Planning Analytics Tips & Tricks: Creating Selectors in Planning Analytics Workspace

IBM Planning Analytics Tips & Tricks: Creating Buttons in Planning Analytics Workspace

IBM Planning Analytics Tips & Tricks: Synchronizing Selectors in Planning Analytics Workspace

Need more guidance? Take a look at our IBM Planning Analytics Training services and our Customer Care Program.

Home » Planning & Reporting » Page 13

Filed Under: IBM Planning Analytics Tips & Tricks Tagged With: Analytics, Budgeting, Budgeting Planning & Forecasting, Financial Performance Management, FP&A, IBM Planning Analytics, Planning & Forecasting, Planning & Reporting, TM1

IBM Planning Analytics Tips & Tricks: PA Modeling – The Dimension Editor

April 9, 2019 by Revelwood Leave a Comment

Tips & Tricks

This is a guest post from Revelwood’s Shane Bethea.

Did you know that you can quickly and easily create a new time dimension in the Planning Analytics Workspace (PAW) Dimension editor? The following steps will automatically create a time dimension with a standard hierarchy and pre-populated set of attributes in a matter of seconds.

To create your time dimension using the PAW Dimension editor, simply right click Dimensions in the left hand navigation tree and select Create dimension.

IBM Planning Analytics Tips & Tricks: The Dimension Editor

Enter a name for your new time dimension and then click Create.

IBM Planning Analytics Tips & Tricks: Understanding the Dimension Editor

Select the ‘Customize as Time’ button to open the time interface.

IBM Planning Analytics Tips & Tricks: How to use the Dimension Editor

Select the start year, end year, and element granularity (Year, Quarter, or Month) and then click Create.

Understanding the dimension editor in IBM Planning Analytics Workspace

This will create a new time dimension, complete with a calendar year’s Year/Quarter/Month hierarchy and a standard set of attributes.

Working with the Dimension Editor in IBM Planning Analytics Workspace

Once created, you can add or modify these attributes based on your reporting and analytics needs. Stay tuned for more entries covering more features and the other modeling widgets.

IBM Planning Analytics is full of new features and functionality. Not sure where to start? Our team here at Revelwood can help. Contact us for more information at info@revelwood.com. And stay tuned for more Planning Analytics Tips & Tricks weekly in our Knowledge Center and in upcoming newsletters!

Learn more IBM Planning Analytics Tips & Tricks:

IBM Planning Analytics Tips & Tricks: Creating Selectors in Planning Analytics Workspace

IBM Planning Analytics Tips & Tricks: Creating Buttons in Planning Analytics Workspace

IBM Planning Analytics Tips & Tricks: Synchronizing Selectors in Planning Analytics Workspace

Need more guidance? Take a look at our IBM Planning Analytics Training services and our Customer Care Program.

Home » Planning & Reporting » Page 13

Filed Under: IBM Planning Analytics Tips & Tricks Tagged With: Analytics, Budgeting, Budgeting Planning & Forecasting, Financial Performance Management, IBM Planning Analytics, Planning & Forecasting, Planning & Reporting, TM1

IBM Planning Analytics Tips & Tricks: The Benefits of Using Hierarchies

April 2, 2019 by Nina Inverso Leave a Comment

Tips & Tricks

Did you know there are several benefits to using hierarchies in IBM Planning Analytics?

Hierarchies are one of the additional features available in Planning Analytics. The main benefit of hierarchies is that they enable users to see alternative data rollups in the same view. There are several reasons to take advantage of this new approach to interacting with your data.

Hierarchies can improve query performance. Modeling attributes as hierarchies instead of dimensions can save memory space. This allows for cubes with fewer dimensions, while using hierarchies as virtual dimensions.

 Attributes can be turned into hierarchies. Hierarchies provide greater flexibility. Updating a hierarchy is as easy as updating an attribute. A single dimension can contain multiple hierarchies, and multiple hierarchies can be displayed in the same view.

 Hierarchies can be created and maintained manually or via TurboIntegrator process. This gives users flexibility to choose the method by which their hierarchies are maintained. Planning Analytics provides a user-friendly interface for manual maintenance, while TI processes can make automated maintenance fast and simple.

Planning Analytics hierarchies enable you to gain informative and flexible insight into your data, while utilizing fewer resources.

IBM Planning Analytics is full of new features and functionality. Not sure where to start? Our team here at Revelwood can help. Contact us for more information at info@revelwood.com. And stay tuned for more Planning Analytics Tips & Tricks weekly in our Knowledge Center and in upcoming newsletters!

Read more IBM Planning Analytics Tips & Tricks:

IBM Planning Analytics Tips & Tricks: GMT vs Local Time

IBM Planning Analytics Tips & Tricks: Captions

IBM Planning Analytics Tips & Tricks: Regions with Planning Analytics Rules

Need more guidance? Take a look at our IBM Planning Analytics Training services and our Customer Care Program.

Home » Planning & Reporting » Page 13

Filed Under: IBM Planning Analytics Tips & Tricks Tagged With: Analytics, Budgeting, Budgeting Planning & Forecasting, Financial Performance Management, IBM Planning Analytics, Planning & Forecasting, Planning & Reporting, TM1

IBM Planning Analytics Tips & Tricks: Tracing Calculations in Planning Analytics Workspace

March 26, 2019 by Lee Lazarow Leave a Comment

Tips & Tricks

Did you know that you can trace the details of a calculation in an IBM Planning Analytics Workspace exploration? The following screen shot shows a simple revenue calculation that uses input values for Units and Unit Price.

IBM Planning Analytics Tips & Tricks: PAW Tracing

You can right click on the revenue value and select the option of “trace cell” to see the details of the calculation. The trace will show me the calculated result, the formula, and the values for each component of the formula.

IBM Planning Analytics Tips & Tricks: Understanding PAW Tracing

And as of version 2.0.39, you can also trace feeders. Right click on a leaf cell and select the option to “Trace Feeders”. The trace will show me the feeder line from the rule and will also give me the status of each feeder.

IBM Planning Analytics Tips & Tricks: Planning Analytics Workspace Tracers

Tracing values and feeders will allow both end users and developers to better analyze and optimize your Planning Analytics environment.

IBM Planning Analytics is full of new features and functionality. Not sure where to start? Our team here at Revelwood can help. Contact us for more information at info@revelwood.com. And stay tuned for more Planning Analytics Tips & Tricks weekly in our Knowledge Center and in upcoming newsletters!

Learn more IBM Planning Analytics Tips & Tricks:

IBM Planning Analytics Tips & Tricks: Creating Selectors in Planning Analytics Workspace

IBM Planning Analytics Tips & Tricks: Creating Buttons in Planning Analytics Workspace

IBM Planning Analytics Tips & Tricks: Synchronizing Selectors in Planning Analytics Workspace

Home » Planning & Reporting » Page 13

Filed Under: IBM Planning Analytics Tips & Tricks Tagged With: Analytics, Beyond Budgeting, Budgeting, Budgeting Planning & Forecasting, Financial Performance Management, IBM Planning Analytics, Planning & Forecasting, Planning & Reporting, TM1

FP&A Done Right: Even Google Maps Requires a Starting Point

March 22, 2019 by Brian Combs Leave a Comment

FP&A Done Right

Current Location. Destination. That’s it. That is all you need to provide your favorite mapping app for it to create a route. No current location? You will not know where to begin or how long it will take to get there. No destination? You will drive aimlessly with no end in sight. Your finance transformation or business process improvement is no different. We all recognize the need to determine our future state. But you also need to spend time understanding your current state so you can create a road map detailing how you will achieve that future state. How will you attain your long-term vision if you don’t know where you are starting from?

FP&A Done Right

Oftentimes, we simply jump directly to our desired or future state process discussions and then believe we can move straight into implementing those changes. Who cares about the current state, right? I often hear, “Brian, we don’t need to spend time on our current state process. We already know what it is.” Really? Are you sure? I had myself convinced of that same thing…right until I hit my first roadblock.

I was sure that I knew what each group did during the forecast process. After all, I created many of the schedules and reports that we used and personally trained the teams on every step. While discussing why it took so long to create one of those data input schedules, I uncovered that the functional group took the source data and “massaged” it a bit (deleted rows and columns, inserted and renamed items, etc) to put it in the format they were used to seeing. Then, they sent the file to someone on my team who simply undid much of the previous work and changed it back so it fit our process! We had no idea that the format we preferred was actually the initial extract of the source data. I happened to walk by someone’s desk at just the right time and saw something on their computer screen. After a few questions, we significantly reduced the time required to generate the same sheet.

Don’t underestimate the importance of spending adequate time mapping out and truly understanding your current state process. Don’t fool yourself into thinking that “the process” is being followed 100% of the time. Make sure to uncover those pesky little shortcuts that people take to circumvent the process. Uncover the waste in your current process and then create a future state that eliminates it. I can ensure you that time spent upfront can payback multi-fold during your transformation.

Of course, you could attempt to implement your desired future state without first understanding your starting point. If you do, call me after you are over budget and too dizzy to continue. I’ll be happy to help and I promise to do my best not to say, “I told you so.”

Read more blog posts in our FP&A Done Right series:

FP&A Done Right: The Importance of Naming Conventions – Names Really Can Hurt

FP&A Done Right: The Flexibility of Today’s FP&A Systems is Both a Blessing and a Curse

FP&A Done Right: Finance as the Conductor

FP&A Done Right: You Can’t “System” Your Way out of This

FP&A Done Right: Introduction

Home » Planning & Reporting » Page 13

Filed Under: FP&A Done Right Tagged With: Analytics, Budgeting, Budgeting Planning & Forecasting, Financial Performance Management, FP&A, Planning & Forecasting, Planning & Reporting

Can You Recover From Static Planning by 2020?

March 19, 2019 by Revelwood Leave a Comment

FP&A Done Right

This is a guest blog post from Rob Hull, founder, Adaptive Insights.

Scramble like hell to pull together a budget. Execute against that budget regardless of changes in the business. Repeat the budget scramble in 12 months.

If your corporate planning process still looks like this, then you’re likely stuck in static planning. By that I mean a planning, reporting, and analytics process that’s siloed, largely manual, almost always built around spreadsheets, and constrained by limited insights into the operations of the business.

Static planning may appear to have served you well for years; in fact, for decades it was the standard way for all businesses to plan. It worked, until it didn’t.

In the past few years, the world has gotten smaller, faster, and more data driven. And whether they know it or not, organizations that plan poorly are operating on borrowed time. That’s because the requirements for effective financial and operational planning, reporting, and analytics have risen sharply and suddenly, spurred by compounding changes that threaten to overwhelm businesses that can’t operationalize new strategies to navigate them. These changes include spiraling operational complexity, growing amounts of inscrutable data, disruptive new digital-native competitors, and ever-growing customer expectations.

Navigating constant change

Any one of these changes would prove challenging. All of them together require a significant leap for any business.

Take data growth. As my colleague Tom Bogan noted recently, 90% of all the world’s data didn’t even exist two years ago. So within two years—close to the end of 2020—your business will likely be trying to manage and make sense of twice the volume of data you’re working with today.

Static planning is a poor fit for this new age of data proliferation. Businesses that base their decisions on instinct, rather than data-driven insights, tend to be less agile. They respond sluggishly to changes in the business or market—if they respond at all. Compare that to data-driven businesses, which on average grow a healthy 30% annually. Very few businesses that rely on static planning will successfully navigate our rapidly changing business world. You can’t chart your way forward through constant, rapid change by being slow, rigid, and myopic in your decision-making process.

The good news is you can recover from your static planning environment before it’s too late—before your competitors outpace you or before events overtake you. You can be one of the nimble, data-driven businesses that are the leaders of tomorrow.

The answer is active planning

Active planning is different from static planning in three key ways.

  1. It’s collaborative. It allows everybody in the business to plan and escalates critical decisions to the right people while giving them the information and insight they need to make the right choice.
  2. It’s continuous. Instead of a painful annual planning process that quickly grows stale, active planning is ongoing and infused by a constant stream of trusted, always-current data.
  3. It’s comprehensive. Active planning enables a holistic view of the business, connecting together finance, sales, workforce, and other operational planning, reporting, and analytics and integrating them with ERP, HCM, CRM, and other operational data stores.

Organizations that implement active planning processes are four times more likely to be able to respond to a market change than those still stuck with static planning. That’s a decent definition of agility if ever I’ve heard one.

Active planning by 2020? Start now

If this sounds too good to be true, be assured there are thousands of companies that have abandoned static planning and embarked on their own journey to active planning. They’ve done it by replacing spreadsheets and rigid legacy planning platforms with cloud-based planning solutions built to handle large and varied volumes of frequently changing data, yet are accessible and easy to use by a wide range of business users. And, since they know that their organization and the demands on it will only grow in the future, they’ve chosen technology that scales quickly and painlessly across different systems, locations, and environments. Operating a business is growing more complex, so planning should accommodate that complexity while still being simple enough for virtually anyone to do.

With an active planning environment, you’ll find it far easier to model what-if scenarios so you’ll be ready to course-correct when change happens. You’ll be able to determine your optimal workforce mix while setting sales quotas and drawing territories that keep account reps motivated and productive. And you’ll be able to lower the risks associated with your business decisions because forecasts are based not just on historical trends, but also on real-world, even real-time data and the input of managers closest to each part of your business.

Modern business planning is now a strategic advantage, and in today’s business environment, you need all the advantages you can find. So it follows that outdated modes of planning amount to a competitive disadvantage. Every day you spend mired in static planning is another day you’re allowing your competitors to move ahead, extending the gap between where you are and where the future demands you must go.

2020 will be here before you know it. The 4,000-plus organizations we’ve worked with to adopt active planning will be far more prepared to succeed in a world of constant change. Will you?


Home » Planning & Reporting » Page 13

Filed Under: News & Events Tagged With: Adaptive Insights, Analytics, Budgeting, Budgeting Planning & Forecasting, Financial Performance Management, FP&A, Plan to Win, Planning & Forecasting, Planning & Reporting

IBM Planning Analytics Tips & Tricks: Buttons to run TI Processes

March 19, 2019 by Lee Lazarow Leave a Comment

Tips & Tricks

Did you know IBM Planning Analytics Workspace (PAW) has new features? Version 2.0.39 of PAW introduced the ability for buttons to run Turbo Integrator processes. When creating a button, you now have the option to set the target to “Run Process”. Once selected, you will have drop down selectors to define the server where the process is located and the name of the process.

IBM Planning Analytics Tips & Tricks: PAW Button Refresh

You can also control the parameters. They can be hard coded values or you can prompt the user to input value. The user prompts allow for general text input, a predefined hard coded list, or an element list which either uses an existing hierarchy or an existing subset.

IBM Planning Analytics Tips & Tricks: Understanding the PAW button process

You can still control the appearance of the button using the other button properties. This allows you to control aspects such as colors, fonts, and wording. When used properly, buttons will help simplify the Planning Analytics experience and make your planning and reporting approach easier for your end users.

IBM Planning Analytics is full of new features and functionality. Not sure where to start? Our team here at Revelwood can help. Contact us for more information at info@revelwood.com. And stay tuned for more Planning Analytics Tips & Tricks weekly in our Knowledge Center and in upcoming newsletters!

Learn more IBM Planning Analytics Tips & Tricks:

IBM Planning Analytics Tips & Tricks: Creating Selectors in Planning Analytics Workspace

IBM Planning Analytics Tips & Tricks: Creating Buttons in Planning Analytics Workspace

IBM Planning Analytics Tips & Tricks: Synchronizing Selectors in Planning Analytics Workspace

Home » Planning & Reporting » Page 13

Filed Under: IBM Planning Analytics Tips & Tricks Tagged With: Analytics, Beyond Budgeting, Budgeting, Budgeting Planning & Forecasting, Financial Performance Management, IBM Planning Analytics, Planning & Forecasting, Planning & Reporting, TM1

IBM Planning Analytics Tips & Tricks: New Features in PAW – Data Refresh

March 12, 2019 by Lee Lazarow Leave a Comment

Tips & Tricks

Did you know that there are new features in IBM Planning Analytics Workspace (PAW)? We’ll cover these new features in the next few blog posts. Today, we’ll discuss how you can set your data refresh definitions directly from the short cut bar. The “Grid Refresh” option allows you to determine when your data refreshes.

IBM Planning Analytics Tips & Tricks: PAW Data Refresh

This parameter gives you two options:

IBM Planning Analytics Tips & Tricks: Understanding the PAW Data Refresh

After each context change: when selected, data will be refreshed anytime the structure of the view is modified. This includes the swapping of rows and columns, the expansion or collapsing of members in the rows or columns, changing values in the context areas, and using snap commands.

Defer on leaf data change: when selected, data will only be refreshed when an action is taken to refresh the data. These actions include manually clicking a refresh button, entering data in consolidated cells, using data spreading, and updating cells from a date picker.

Just like Excel’s workbook calculation settings, PAW explorations allow you to define your refresh settings.

IBM Planning Analytics is full of new features and functionality. Not sure where to start? Our team here at Revelwood can help. Contact us for more information at info@revelwood.com. And stay tuned for more Planning Analytics Tips & Tricks weekly in our Knowledge Center and in upcoming newsletters!

Learn more IBM Planning Analytics Tips & Tricks:

IBM Planning Analytics Tips & Tricks: Swap Rows & Selectors in Planning Analytics Workspace

IBM Planning Analytics Tips & Tricks: Creating Selectors in Planning Analytics Workspace

IBM Planning Analytics Tips & Tricks: Creating Buttons in Planning Analytics Workspace

Home » Planning & Reporting » Page 13

Filed Under: IBM Planning Analytics Tips & Tricks Tagged With: Analytics, Beyond Budgeting, Budgeting, Budgeting Planning & Forecasting, Financial Performance Management, IBM Planning Analytics, Planning & Forecasting, Planning & Reporting, TM1

IBM Planning Analytics Tips & Tricks: Planning Analytics Administration

February 26, 2019 by Revelwood Leave a Comment

Tips & Tricks

This is a guest post from Revelwood’s Shane Bethea.

Did you know there is a new interface in IBM Planning Analytics? You may have used TM1Top or TM1 Operations Console in the past with TM1 and wondered if something new replaced those tools in Planning Analytics. The answer is yes. The new interface that has been introduced in Planning Analytics called Planning Analytics Administration (PAA). It is accessible to administrators via PA Workspace (PAW). Note: At the time of this writing, PAA is only available in the IBM cloud version of Planning Analytics.

PAA combines features from TM1Top and Operations Console and then adds many new features on top of it. Administrators can use the PAA dashboard to monitor the health of the overall Planning Analytics environment and also oversee each individual TM1/Planning Analytics server running within the environment.

The interface is customizable and lets you set safe/concern/critical thresholds for things like blocked threads, memory usage, CPU usage, and disk usage. Once certain critical levels are reached, email alerts can be configured to inform system administrators of the problem.

Other features of the PAA dashboard include the ability to:

  • Start/stop/restart TM1/PA servers
  • View/cancel long running threads
  • Disconnect users
  • Change tm1s.cfg configuration settings
  • Set up and maintain Secure Gateway connections
  • Download error logs from the TM1/PA environment
  • Download documentation (installation guide, new features, fix list)
  • Download the latest version of Planning Analytics for Excel (PAx)

To access the Planning Analytics Administration dashboard, login to your PAW environment and click the Administration tile in the top right corner.

IBM Planning Analytics Tips & Tricks: Planning Analytics Administration

The main dashboard will show the overall health of the environment and display a tile for each running and stopped TM1/PA server. Note: Throughout the interface, green means safe, yellow means concern, and red means critical.

IBM Planning Analytics Tips & Tricks: Learn about Planning Analytics Administration

You can click on the name of an individual TM1/PA server and see a more detailed view of that server.

IBM Planning Analytics Tips & Tricks: Tips for Planning Analytics Administration

This is a simple overview of the Planning Analytics Administration dashboard. Stay tuned for more detailed entries.

IBM Planning Analytics is full of new features and functionality. Not sure where to start? Our team here at Revelwood can help. Contact us for more information at info@revelwood.com. And stay tuned for more Planning Analytics Tips & Tricks weekly in our Knowledge Center and in upcoming newsletters!

Read more IBM Planning Analytics Tips & Tricks:

IBM Planning Analytics Tips & Tricks: Setting Default Members

IBM Planning Analytics Tips & Tricks: Using Excel to get Client Information

IBM Planning Analytics Tips & Tricks: Duplicating Sheets

Did you know Revelwood offers a Customer Care program? Learn more. 

Home » Planning & Reporting » Page 13

Filed Under: IBM Planning Analytics Tips & Tricks Tagged With: Analytics, Budgeting Planning & Forecasting, Financial Performance Management, IBM Planning Analytics, Planning & Reporting, TM1

  • « Go to Previous Page
  • Page 1
  • Interim pages omitted …
  • Page 11
  • Page 12
  • Page 13
  • Page 14
  • Page 15
  • Interim pages omitted …
  • Page 22
  • Go to Next Page »

Footer

Revelwood Overview

Revelwood helps finance organizations close, consolidate, plan, monitor and analyze business performance. As experts in solutions for the Office of Finance, we partner with best-in-breed software companies by applying best practices guidance and our pre-configured applications to help businesses achieve their full potential.

EXPERTISE

  • Workday Adaptive Planning
  • IBM Planning Analytics
  • BlackLine

ABOUT

  • Who We Are
  • What We Do
  • How We Help
  • How We Think
  • Privacy

CONNECT

World Headquarters

Florham Park, NJ | 201 984 3030

European Headquarters

London & Edinburgh | +44 (0)131 240 3866

Latin America Office

Miami, FL | 201 987 4198

Email
info@revelwood.com

Copyright © 2025 · Revelwood Inc. All rights reserved. Revelwood® and the Revelwood logo are registered marks of Revelwood Inc.