IBM Planning Analytics Workspace lets you create pop-out boxes in your books to make key numbers stand out. You can watch this tip in action in our “Make Numbers Pop with Linked Textboxes | IBM Planning Analytics Tips & Tricks from Revelwood” video.
Want to achieve the same effect in Excel? You can easily do this using text boxes—here’s how.
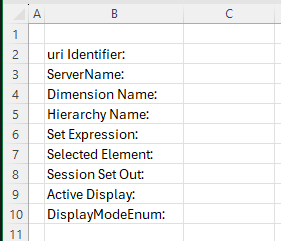
Here’s how to link a cell to a text box:
1 – Create a textbox on a worksheet using the icon within the Insert, Text ribbon.
2 – Click on the textbox border. Once clicked, the blinking cursor will disappear.
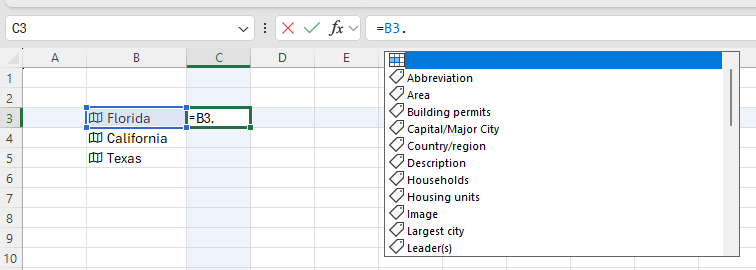
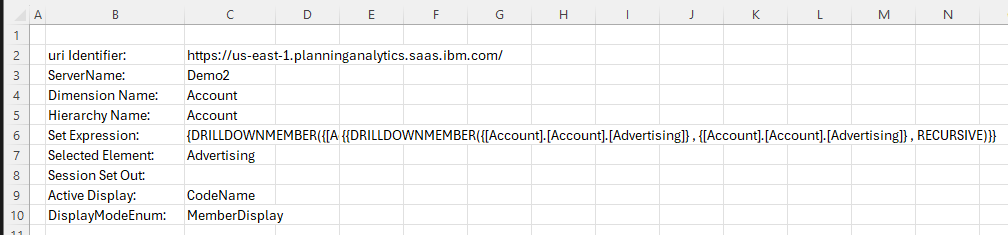
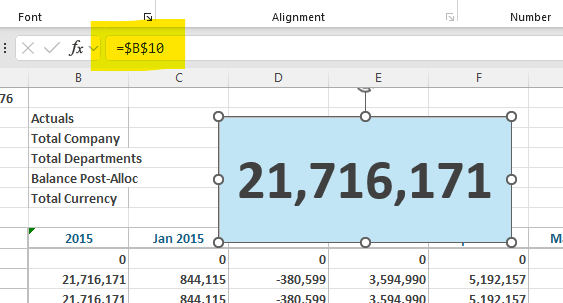
3 – Enter an equal sign into the formula bar and then click on the cell that you want to display in the textbox.
You will now see the text box linked to the cell in the formula bar. From here, you can change the format of the textbox to make the number stand out (ex: larger fonts, background colors, etc.).
Revelwood is an IBM Gold Business Partner with more than 30 years of experience designing, developing, implementing and maintaining IBM Planning Analytics environments. We focus on solutions for the Office of Finance and have partnered with clients of all sizes across all industries to optimize, enhance and expand their use of Planning Analytics. Revelwood’s Planning Analytics team consists of PA experts with decades of experience, and we have been recognized via awards including IBM Champion status.
Stay up to date with PA – sign up for our weekly Planning Analytics Tips & Tricks newsletter, subscribe to our YouTube channel, and join our IBM Planning Analytics All-Stars group on LinkedIn.
Read more IBM Planning Analytics Tips & Tricks:
Previewing Changes on Bulk Updates in IBM Planning Analytics