This is a guest post by Revelwood’s Shane Bethea.
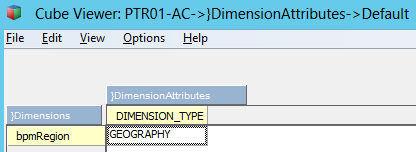
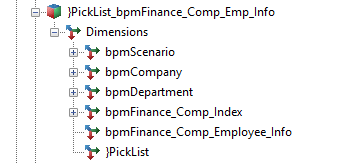
Did you know you can use MDX to compare dimension hierarchies? IBM Cognos TM1 dimensions often have multiple hierarchies that should all roll up to the same total. Said another way, these separate hierarchies should all contain the same set of n-level elements below them. For example, a customer dimension may have a hierarchy for rolling up the ‘All Customers – by Type’ and another for ‘All Customers – by Region.’ A TI process can be used to maintain the elements in the dimension and these two hierarchies, but sometimes the two hierarchies may become out of sync. MDX can be used to see if both hierarchies contain the exact same number of n-level customers and, if the two hierarchies are out of sync, identify the elements causing the problem.
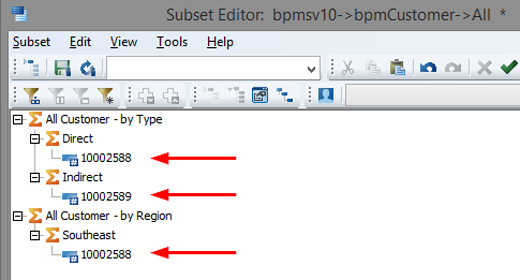
In our example above, let’s say that a customer was added to the dimension within the ‘by Type’ hierarchy but not within the ‘by Region’ hierarchy. If two separate reports were written to pull the total revenue for all customers then the reports would show inconsistent values. This is because the ‘by Type’ hierarchy would have one more customer than the ‘by Region’ hierarchy.
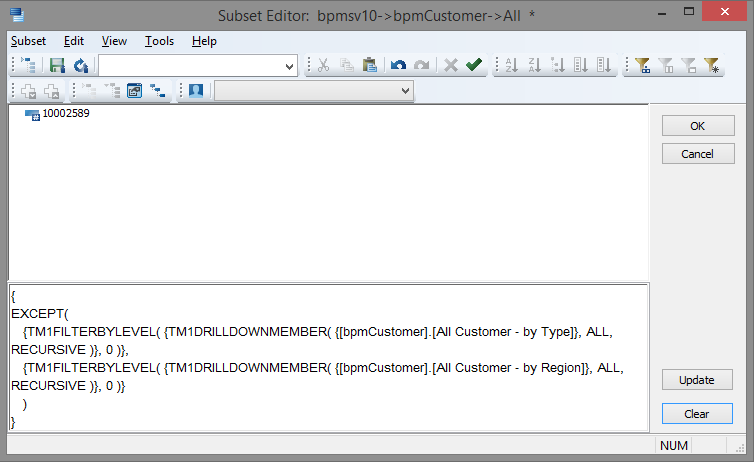
To quickly figure out where the difference lies between the two hierarchies, an MDX statement can be used to compare the n-level elements within the two hierarchies.
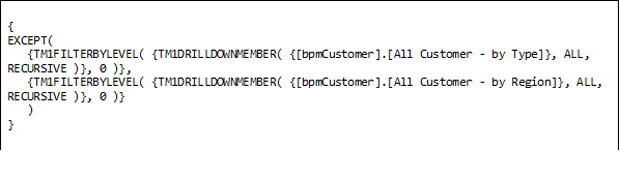
The MDX statement above uses the ‘EXCEPT’ function and will yield the difference between the ‘All Customer – by Type’ hierarchy and the ‘All Customer – by Region’ hierarchy. The result of the MDX statement is the one n-level element that is missing from the ‘by Region’ hierarchy. From here, you can investigate why the element was added to one hierarchy and not the other.
IBM Planning Analytics, which TM1 is the engine for, is full of new features and functionality. Not sure where to start? Our team here at Revelwood can help. Contact us for more information at info@revelwood.com. And stay tuned for more Planning Analytics Tips & Tricks weekly in our Knowledge Center and in upcoming newsletters!