Have you ever wanted to export a dimensional structure to an ASCII based text file in IBM Planning Analytics Workspace (PAW)? PAW version 99 introduced the ability to export a dimension with a single click.
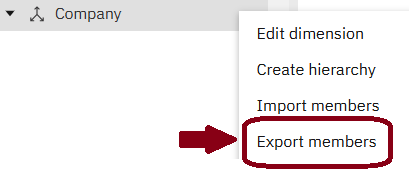
To export a dimension, right-click on the dimension name within a modeling workbench and select the option to Export members.
Once selected, you will be prompted to define which hierarchy to export and the name of the csv file that will be created. The resulting file will contain the following information for each element:
- Name
- Parent (root elements will have a blank parent field)
- Type
- Weight
- All defined attribute names and values (the attribute name will be prefixed with ATTR_N or ATTR_S to define the attribute as numeric or string)
Here is a snippet of an export file that shows a header record, a consolidated element, and two children:
“Member”,”Parent”,”Type”,”Weight”,ATTR_S_Manager”,”ATTR_S_Currency”
“Total Company”,””,”Consolidated”,”0″,”Total”,””
“001”,”Total Company”,”Numeric”,”1″,”John Smith”,”USD”
“002”,”Total Company”,”Numeric”,”1″,”Jane Doe”,”USD”
This feature will allow you to export your dimensional structures to files that can be used for reporting, auditing, and other areas where you need to display your structural information.
Revelwood is an IBM Gold Business Partner with 25+ years of experience designing, developing, implementing and maintaining IBM Planning Analytics environments. Revelwood has helped clients in all sizes across all industries optimize and grow their use of Planning Analytics. Revelwood’s Planning Analytics team consists of experienced PA experts, including a multi-year IBM Champion.
Stay up to date with PA – sign up for our weekly Planning Analytics Tips & Tricks newsletter, subscribe to our YouTube channel, and join our IBM Planning Analytics All-Stars group on LinkedIn.
Read more IBM Planning Analytics Tips & Tricks:
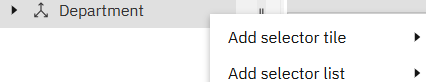
IBM Planning Analytics Tips & Tricks: PAW Selector Menu
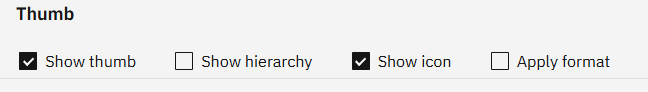
IBM Planning Analytics Tips & Tricks: PAW Thumb Cell Formatting