Did you know that you can easily synchronize your selectors with your IBM Planning Analytics Workspace (PAW) components?
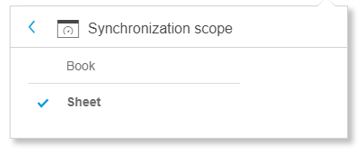
PAW allows you to synchronize your widgets to a selector or set of selectors. This ensures that a change in your selected elements impacts all of the widgets on your page. Synchronization is defined by clicking on the dashboard properties and selecting the option for “Synchronization scope.”
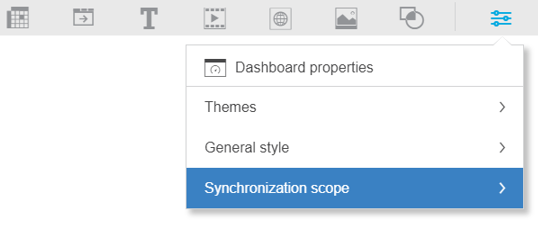
You will be given the option to synchronize items for the selected sheet or throughout the entire book.
Once selected, you can now define the dimensions you want to synchronize throughout the sheet or the book. This approach allows you to create powerful dashboards with live data that can be changed via a single selector.
IBM Planning Analytics is full of new features and functionality. Not sure where to start? Our team here at Revelwood can help. Contact us for more information at info@revelwood.com. And stay tuned for more Planning Analytics Tips & Tricks weekly in our Knowledge Center and in upcoming newsletters!