Did you know IBM Planning Analytics can minimize the amount of feeder data via an approach called a “conditional feeder?” A conditional feeder is exactly what it sounds like – it only feeds when a certain condition is met.
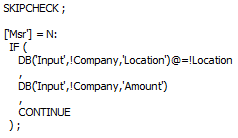
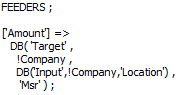
In a previous blog post, I provided an example of how to use an attribute to turn on/off data flow from another cube. We left off with the following rules:
High-Level:

Detailed:
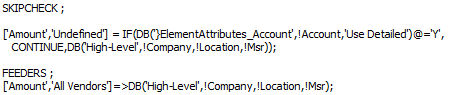
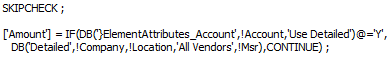
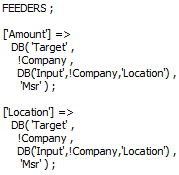
The cube “High-Level” should only pull from “Detailed” if there is a “Y” in the attribute called “Use Detailed”, but we are currently feeding no matter how the attribute is populated. We can add efficiency by incorporating an IF() statement into the feeder. Here’s an example of how the feeder should look:
Detailed:
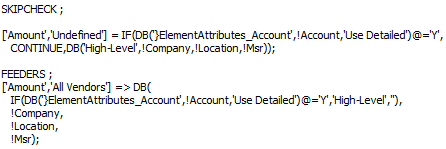
The IF statement will generate one of two results: a valid element to use in the feeder or an invalid result. Planning Analytics will not process an invalid feeder, so any invalid element (including a blank) in the false area will prevent the feeder from occurring.
By writing it in this way, we can turn off/on the feeder by using the same attribute that determines whether to use that line or not.
IBM Planning Analytics is full of new features and functionality. Not sure where to start? Our team here at Revelwood can help. Contact us for more information at info@revelwood.com. And stay tuned for more Planning Analytics Tips & Tricks weekly in our Knowledge Center and in upcoming newsletters!
Read more blog posts with IBM Planning Analytics Tips & Tricks:
IBM Planning Analytics Tips & Tricks: Three Reserved Local Variables in TurboIntegrator
IBM Planning Analytics Tips & Tricks: Using MDX to Compare Dimension Hierarchies
IBM Planning Analytics Tips & Tricks: Planning Analytics for Excel (PAx) VBA API Calls