Did you know there are various shortcuts to force calculations in Excel, and that there is a shortcut that does this for TM1 Perspectives and Planning Analytics for Excel (PAx) as well? Rather than searching for a button in the Excel ribbon, it’s often easier and more efficient to use keyboard shortcuts to refresh calculations. This post describes the various shortcuts available to force calculations in Excel for Windows, including one shortcut that performs this functionality specifically with TM1 Perspectives or Planning Analytics for Excel (PAx).
F9: This shortcut calculates all new, changed, or volatile functions in worksheets for all open workbooks. A few examples of volatile functions include NOW(), RAND(), and TODAY().
Shift+F9: This shortcut calculates only the active worksheet. This includes dependencies that are located within the active worksheet.
Ctrl+Alt+F9: This shortcut calculates all worksheets in all open workbooks, regardless of whether they have changed since the last calculation. If you have multiple workbooks open and each has several tabs, this option can take longer to complete.
Ctrl+Alt+Shift+F9: This shortcut checks dependent formulas and then calculates all cells in all open workbooks, including cells not marked as needing to be calculated.
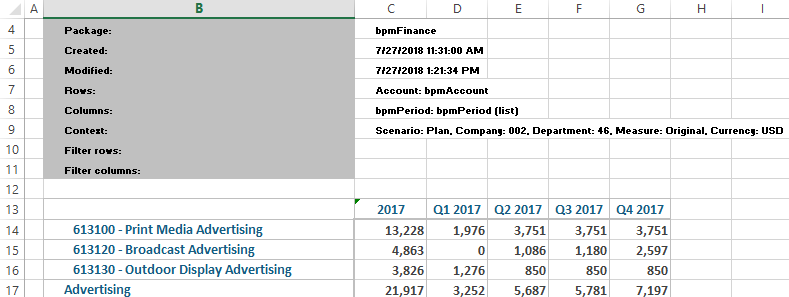
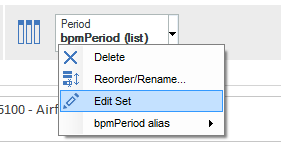
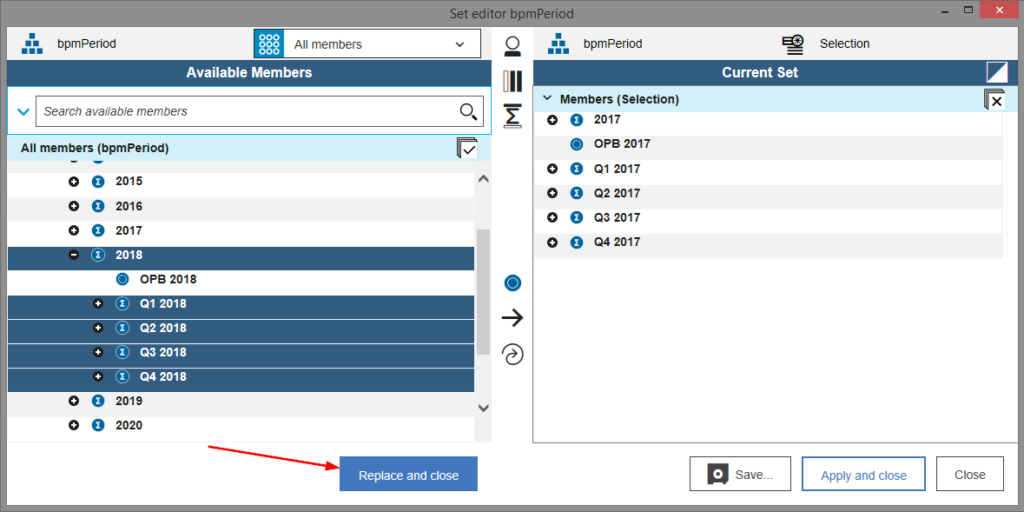
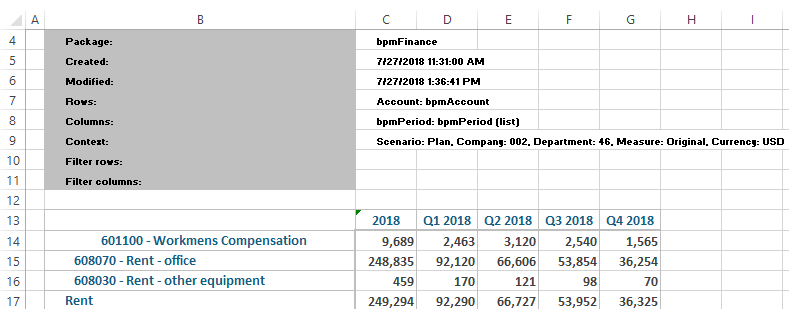
Alt+F9: This shortcut rebuilds all Active Forms (Perspectives) or Dynamic Reports (PAx) on the current worksheet.
Microsoft’s documentation on keyboard shortcuts in Excel for Windows can be found here. IBM’s documentation on recalculating an Active Form can be found here, and their full documentation on keyboard navigation in PAx can be found here.
IBM Planning Analytics is full of new features and functionality. Not sure where to start? Our team here at Revelwood can help. Contact us for more information at info@revelwood.com. And stay tuned for more Planning Analytics Tips & Tricks weekly in our Knowledge Center and in upcoming newsletters!
Read more blog posts on IBM Planning Analytics Tips & Tricks:
IBM Planning Analytics Tips & Tricks: Converting Reports to PAx