Did you know IBM Planning Analytics Workspace allows you to add comments to your data set?
During both planning and reporting cycles, many clients often ask how they can add comments into their data set. After all, the goal of a Planning Analytics database is to have a single source of data … both numeric and text.
Planning Analytics Workspace allows you to insert comments into your explorations quickly and easily.
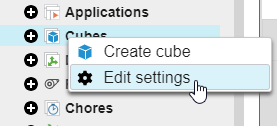
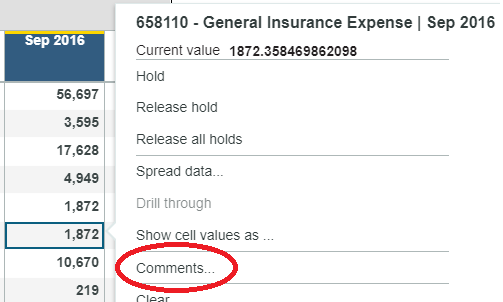
Step 1:
Right click on the cell where you want to insert the comment and select the option for “Comments”. As with all string values in Planning Analytics, comments can be added at either a base level or a consolidated level.
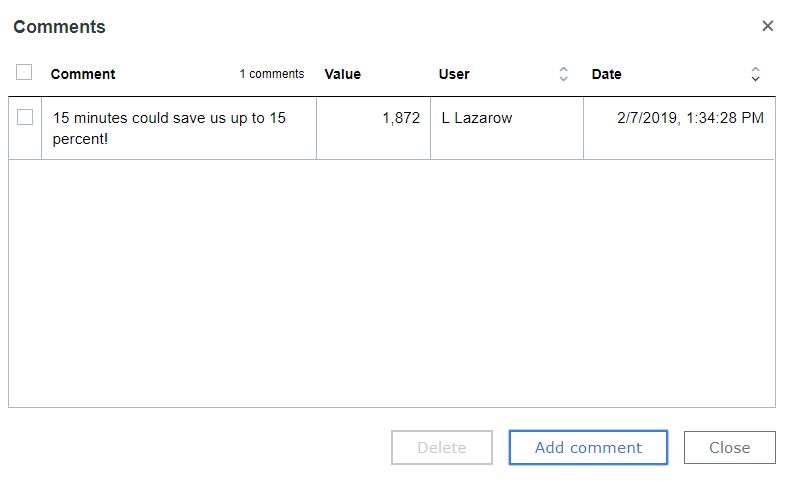
Step 2:
Click on “Add Comment”, enter your comment, and select the option to “Post”. You can enter multiple comments into a single data cell.
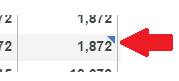
Step 3:
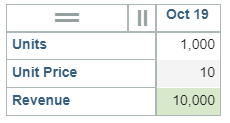
A blue triangle will now appear in the top, right corner. You can follow the tasks in step 1 to review the existing comments.
In addition to viewing the comments in PAW, the information is stored in a control cube called }CellAnnotations_CUBENAME. The data point contains a lot of metadata information to define the caption, the creator, the intersection, and other reference points. However, this data could easily be cleaned up and be included in reports.
IBM Planning Analytics is full of new features and functionality. Not sure where to start? Our team here at Revelwood can help. Contact us for more information at info@revelwood.com. And stay tuned for more Planning Analytics Tips & Tricks weekly in our Knowledge Center and in upcoming newsletters!
Read more blog posts in the IBM Planning Analytics Tips & Tricks Series:
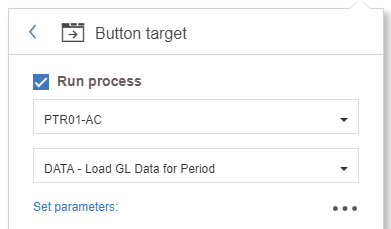
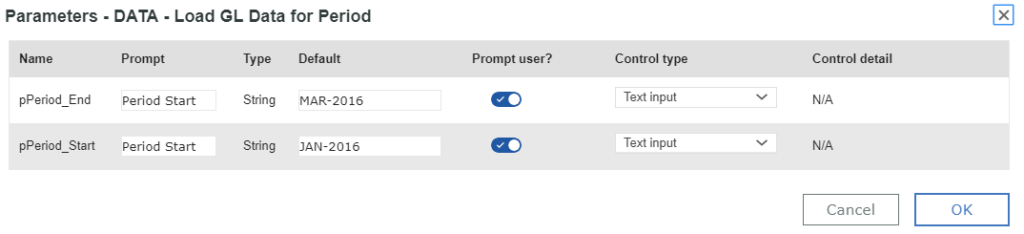
IBM Planning Analytics Tips & Tricks: Creating Buttons in Planning Analytics Workspace (PAW)
IBM Planning Analytics Tips & Tricks: Hiding Dimensions in Planning Analytics Workspace