Linked accounts serve as the backbone of financial modeling in Workday Adaptive Planning. They establish connections between different elements of your financial structure, enabling seamless aggregation and analysis of data across various dimensions. By linking accounts, you can bring data from different models to align for your organization’s reporting and analysis needs.
Understanding Link Filters
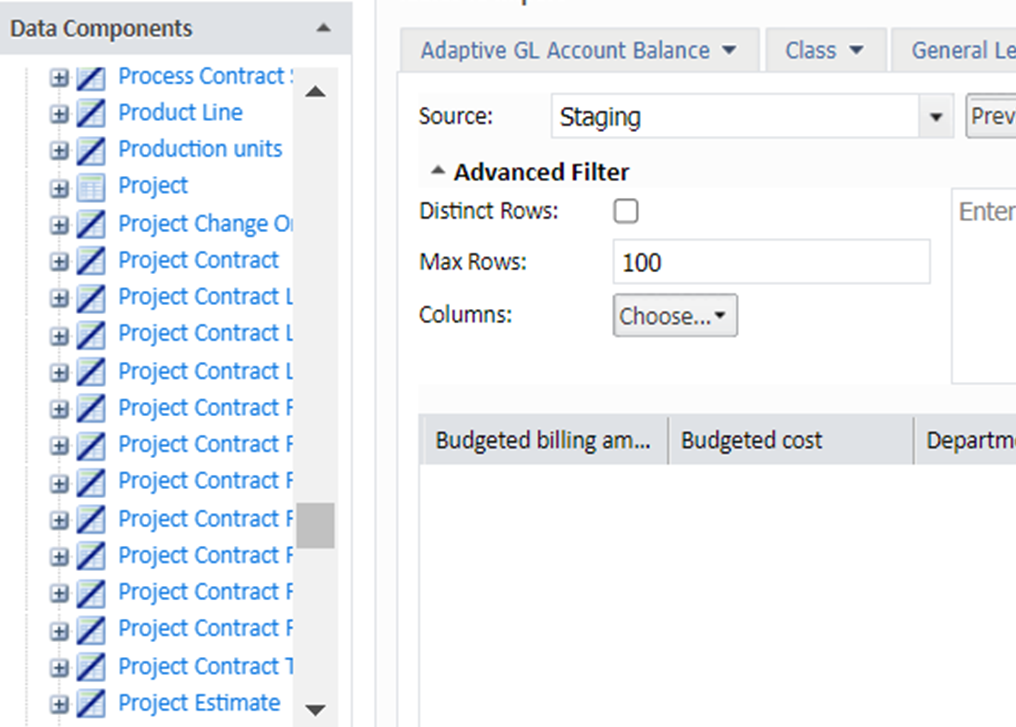
Link filters fall under linked accounts as filters for any dimensionality you have for the model. You can bring in data for specific dimensions you want to see applied to your planning accounts and exclude those you do not. This is especially useful for CapEx and OpEx models where dimensions such as asset type and contract type are used.
Linking Asset with Link Filter to Income Statement
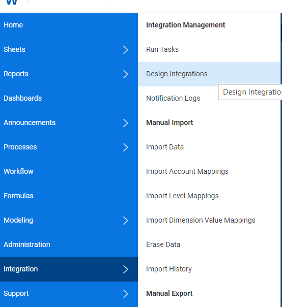
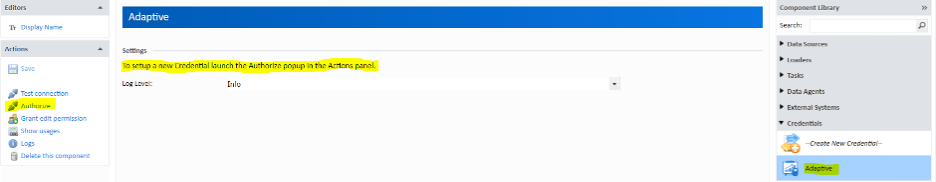
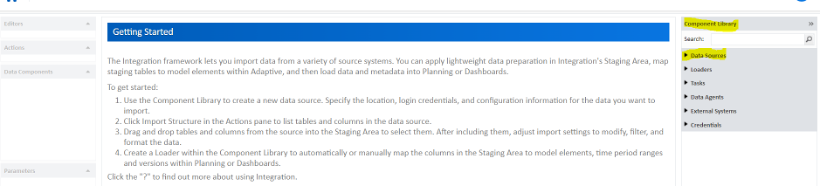
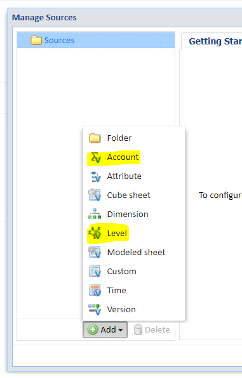
Let’s use the CapEx model as an example. To have the CapEx model reflect on the GL accounts we will have to do a Link. To link the model data to the GL we will have to navigate to:
Modeling > GL accounts > “Expense Depreciation – Furniture & Fixtures.” Within that account details > Type = Link > Add
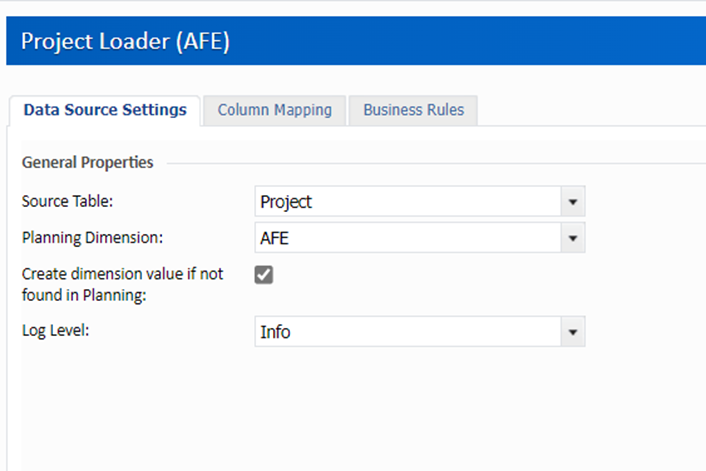
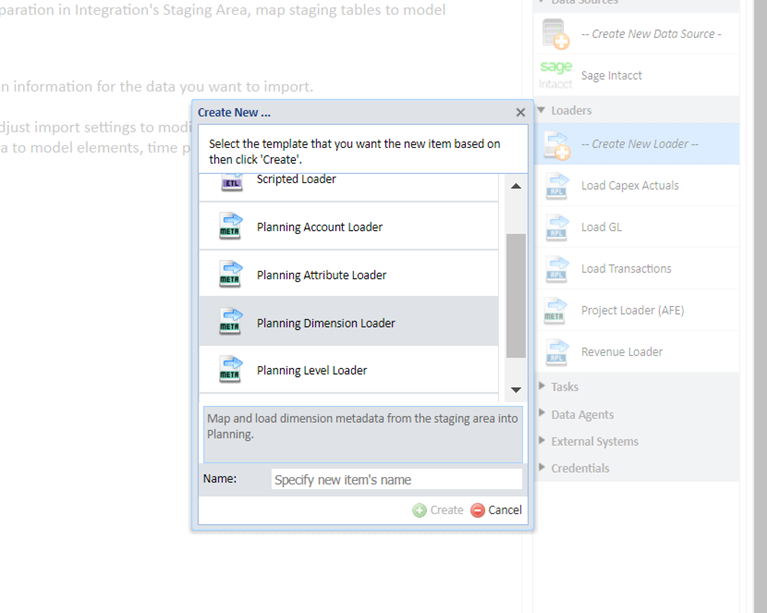
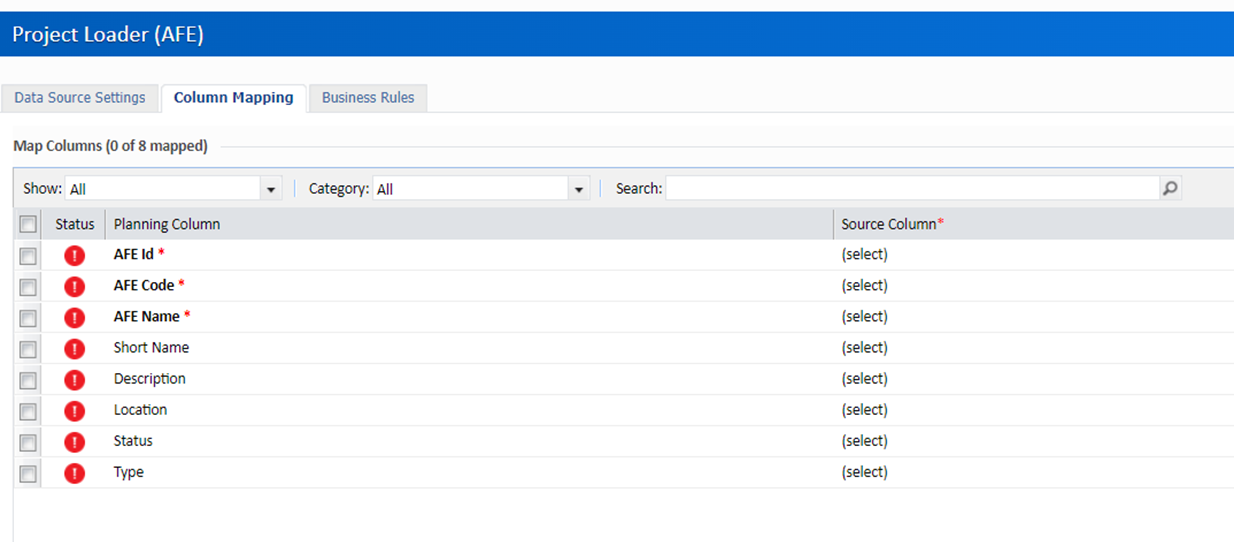
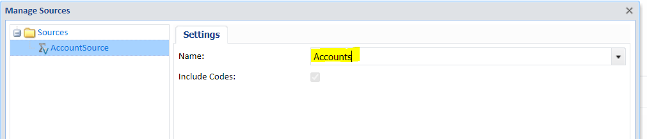
Select the corresponding model you want to reference as well as the account.
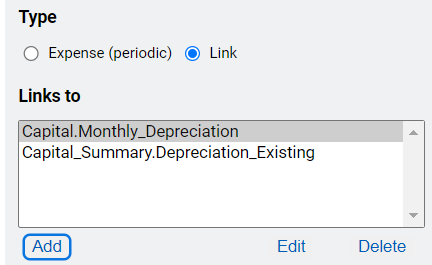
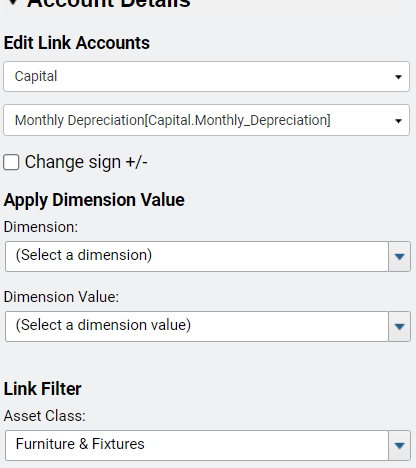
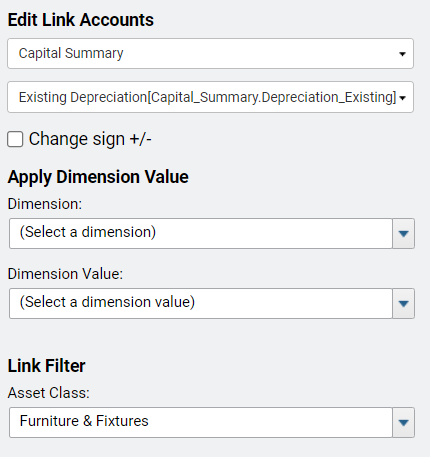
Link the Monthly depreciation with the corresponding asset class in the link filter. In this case, we will apply the filter of Asset Class: “Furniture & Fixtures.” If there is an existing depreciation, link that as well from the capital summary sheet. The GL Account will show the total depreciation amount from the respective capital planning models for just assets with the class “Furniture & Fixtures.”
With linked accounts and link filters, data can be managed efficiently from different models and allows for more flexible and consistent reporting.
Revelwood is an award-winning, Platinum Solution Provider for Workday Adaptive Planning. We build solutions for the Office of Finance that minimize your risk by seamlessly incorporating business analytics into your everyday thinking. By combining the software with our best practices and out-of-the-box applications, we help businesses achieve their full potential with Workday Adaptive Planning.
Read more Workday Adaptive Planning Tips & Tricks:
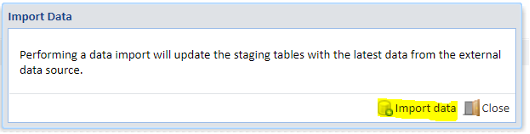
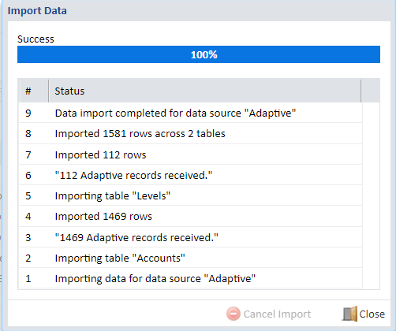
Workday Adaptive Planning Tips & Tricks: Importing with Ease
Workday Adaptive Planning Tips & Tricks: A Practical Guide to Shared Formula Import
Workday Adaptive Planning Tips & Tricks: Capital Summary Sheet – New & Existing Depreciation