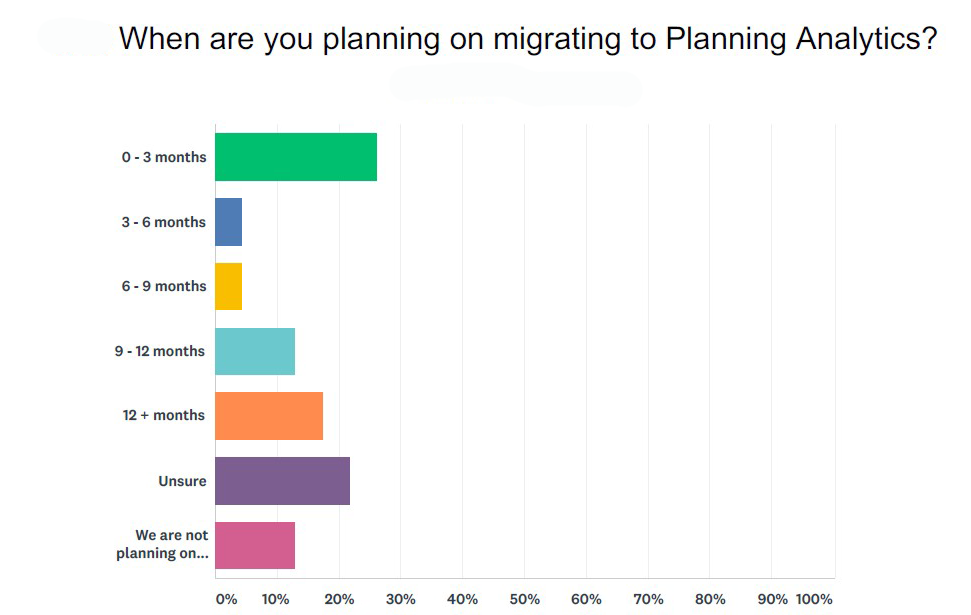
Revelwood’s recent survey of TM1 users uncovered when and why many organizations are planning to migrate from IBM Cognos TM1 to IBM Planning Analytics. The survey, which was conducted in Q4 2017, found that more than one quarter of respondents who are migrating to IBM Planning Analytics are planning on doing so this quarter. Slightly less than 10% of respondents plan to migrate sometime between 3-9 months. Only 13% of all respondents are not migrating to Planning Analytics at all.
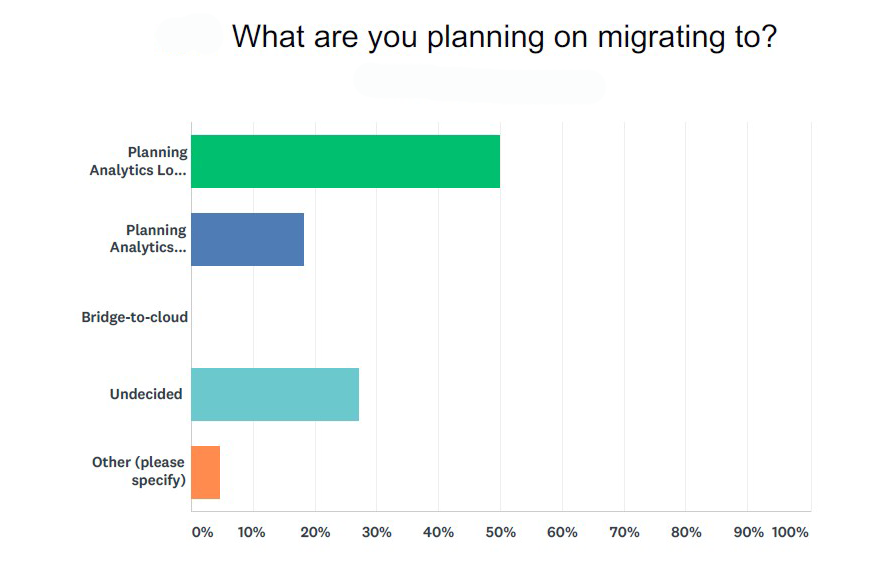
Interestingly, despite the widespread attention on cloud-based solutions, 50% of respondents plan to migrate to IBM Planning Analytics Local. 18% are migrating to Planning Analytics on the cloud and more than one quarter are still undecided if they will opt for an on-premise strategy, a cloud-based version, or a hybrid approach.
The survey also showed there is widespread excitement about several new aspects of Planning Analytics:
- Nearly 85% are very excited or excited about Planning Analytics Workspace
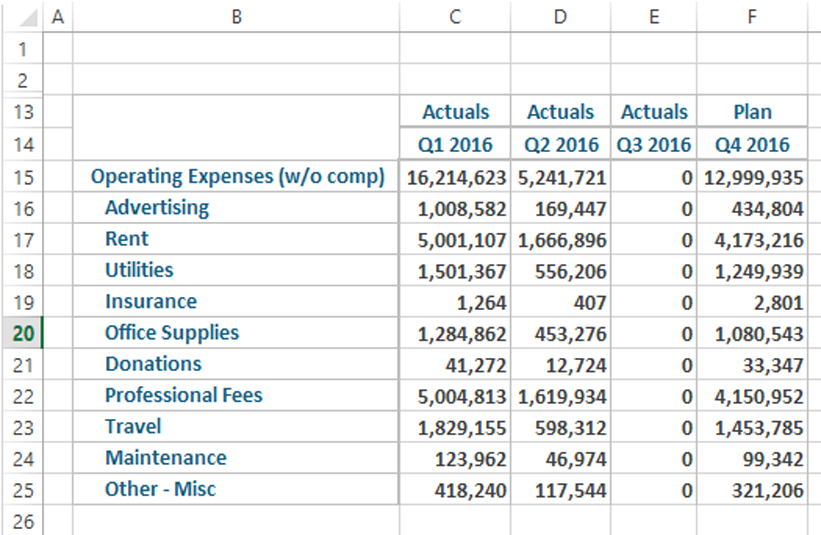
- 67% are very excited or excited about Planning Analytics for Excel (PAx)
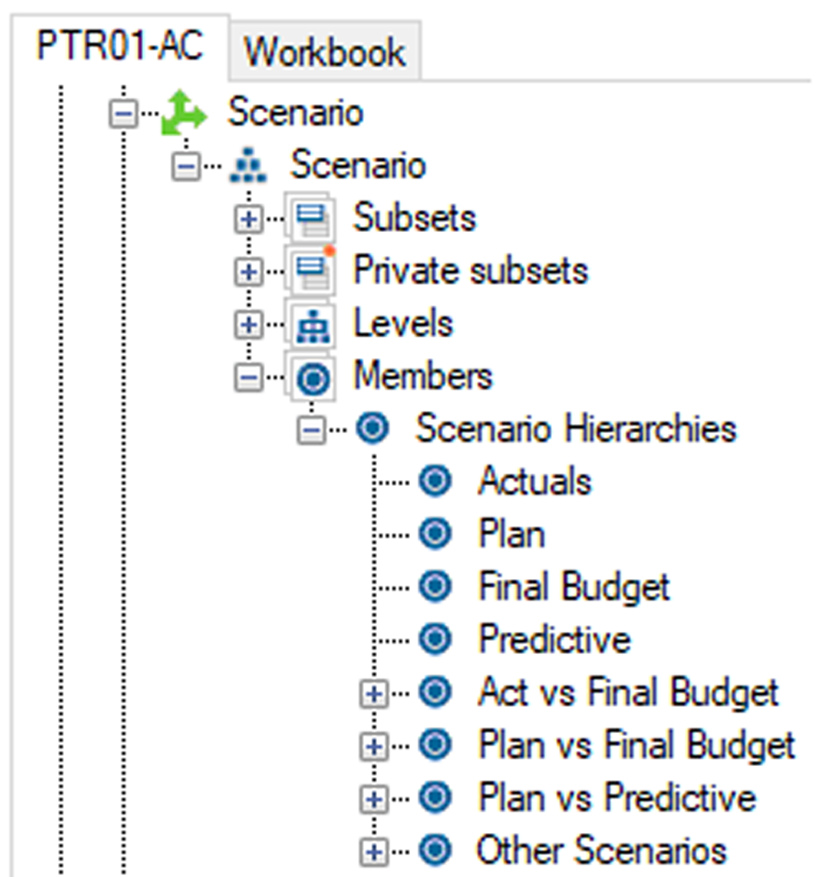
- 52% are very excited or excited about hierarchies
Many of the TM1 users are still eager for information and resources on IBM Planning Analytics and aspects of migrating to the new platform. When asked what they’d like to learn more about, some responses included:
- How to create Planning Analytics for Excel (PAx) reports (62%)
- How to create a Planning Analytics Workspace dashboard (83%)
- Tips & Tricks for using Planning Analytics (87%)
- Unique uses of Planning Analytics inside the office of Finance (79%)
Interested in learning more about migrating from TM1 to IBM Planning Analytics? Contact us if you need any help.