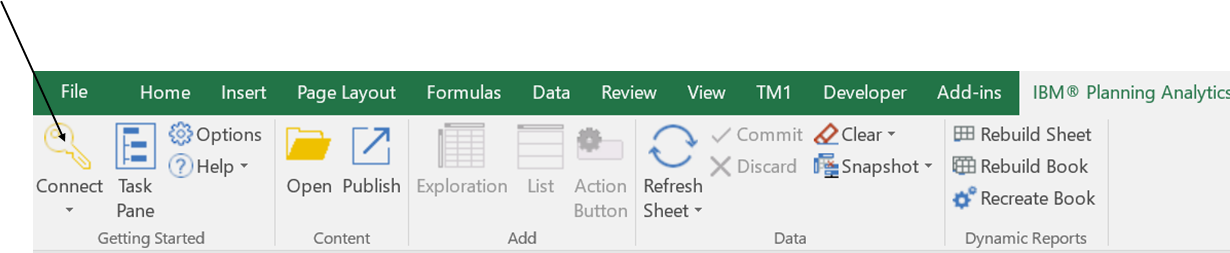
• Skip to main content
  • Skip to footer
Revelwood Logo

Revelwood

Your SUPER-powered WP Engine Site

  • Who We Are
    • About Us
      • Our Company
      • Our Team
      • Partners
    • Careers
      • Join Our Team
  • What We Do
    • Solutions
      • Workday Adaptive Planning
      • IBM Planning Analytics
      • BlackLine
    • Services
      • Implementation Services
      • Customer Care
        • Help Desk
        • System Administration as a Service
      • Training
        • Workday Adaptive Planning Training
        • IBM Planning Analytics / TM1 Training
    • Products
      • DataMaestro
      • LightSpeed
      • IBM Planning Analytics Utilities
  • How We Help
    • Use Cases
    • Client Success Stories
  • How We Think
    • Knowledge Center
    • Events
    • News
  • Contact Us

Financial Performance Management

IBM Planning Analytics Tips & Tricks: Using MDX to Compare Dimension Hierarchies

January 16, 2018 by Revelwood Leave a Comment

Tips & Tricks

This is a guest post by Revelwood’s Shane Bethea. 

Did you know you can use MDX to compare dimension hierarchies? IBM Cognos TM1 dimensions often have multiple hierarchies that should all roll up to the same total.  Said another way, these separate hierarchies should all contain the same set of n-level elements below them.  For example, a customer dimension may have a hierarchy for rolling up the ‘All Customers – by Type’ and another for ‘All Customers – by Region.’  A TI process can be used to maintain the elements in the dimension and these two hierarchies, but sometimes the two hierarchies may become out of sync.  MDX can be used to see if both hierarchies contain the exact same number of n-level customers and, if the two hierarchies are out of sync, identify the elements causing the problem.

In our example above, let’s say that a customer was added to the dimension within the ‘by Type’ hierarchy but not within the ‘by Region’ hierarchy.  If two separate reports were written to pull the total revenue for all customers then the reports would show inconsistent values.  This is because the ‘by Type’ hierarchy would have one more customer than the ‘by Region’ hierarchy.

Using MDX to Compare Dimension Hierarchies

To quickly figure out where the difference lies between the two hierarchies, an MDX statement can be used to compare the n-level elements within the two hierarchies.

Learn how to use MDX to compare dimension hierarchies

The MDX statement above uses the ‘EXCEPT’ function and will yield the difference between the ‘All Customer – by Type’ hierarchy and the ‘All Customer – by Region’ hierarchy.  The result of the MDX statement is the one n-level element that is missing from the ‘by Region’ hierarchy.  From here, you can investigate why the element was added to one hierarchy and not the other.

You can use MDX to compare dimension hierarchies

IBM Planning Analytics, which TM1 is the engine for,  is full of new features and functionality. Not sure where to start?  Our team here at Revelwood can help. Contact us for more information at info@revelwood.com. And stay tuned for more Planning Analytics Tips & Tricks weekly in our Knowledge Center and in upcoming newsletters!

Home » Financial Performance Management » Page 42

Filed Under: IBM Planning Analytics Tips & Tricks Tagged With: Budgeting, Financial Performance Management, IBM Planning Analytics, Planning & Reporting, TM1

IBM Planning Analytics Tips & Tricks: Displaying Data in Maps

January 3, 2018 by Lee Lazarow Leave a Comment

Tips & Tricks

Did you know you can easily visualize data with IBM Planning Analytics Workspace?  IBM Planning Analytics Workspace (PAW) allows you to visualize your data using a variety of charts and graphs, including the ability to display your results via a map.  The only requirement for mapping is to ensure that your geography dimension includes recognizable place names.  IBM defines “recognizable” to include items such as countries, states and provinces and offers a list of acceptable items on their website.

You can create a map in PAW with three easy steps:

1. Ensure that your dimension type is defined as geography within the }DimensionAttributes cube.

Easily visualize data with IBM Planning Analytics Workspac

2. Create a view in PAW with either your rows or columns displaying the geography dimension.

Use IBM Planning Analytics to easily display data as maps.

3. Set your visualization type to be a map.

Visualize data with IBM Planning Analytics Workspace

The resulting display will appear as a map:

Use IBM Planning Analytics Workspace to display data in a map.

Planning Analytics will re-analyze the data set each time you refresh the values.  If at least 80% of the row or column members are recognized as geographic map values then PAW will re-create the map.  This will allow you to quickly shift between worldwide, nationwide and regional maps by simply changing and suppressing the values you want to display.

IBM Planning Analytics  is full of new features and functionality. Not sure where to start?  Our team here at Revelwood can help.  Contact us for more information at info@revelwood.com.  And stay tuned for more Planning Analytics Tips & Tricks weekly in our Knowledge Center and in upcoming newsletters!

Read more IBM Planning Analytics Tips & Tricks:

Tips & Tricks for using TM1: Variance Analysis in IBM Cognos TM1

IBM Planning Analytics Tips & Tricks: Creating Dynamic, Attractive Views and Dashboards

Tips & Tricks for Using IBM Planning Analytics – Creating TM1/Planning Analytics Picklist Cubes

Home » Financial Performance Management » Page 42

Filed Under: IBM Planning Analytics Tips & Tricks Tagged With: Budgeting, Financial Performance Management, IBM Planning Analytics, Planning & Reporting, TM1

Turn Forecasting into a Competitive Advantage

January 2, 2018 by Lisa Minneci Leave a Comment

News & Events

Have you thought about how to turn financial forecasting into a competitive advantage? In today’s disruptive, high-stakes economy, maximizing any and every competitive advantage can mean the difference between just surviving versus thriving. And if you did turn your standard forecasting activities into a competitive advantage, what would that mean for you and your team in the Office of Finance?

A new report from the Financial Executives Research Foundation (FERF) makes a strong argument for how and why forecasting can become a much more strategic activity for your organization. According to FERF, “More effective forecasting and a deeper understanding of how markets are likely to evolve can provide competitive advantage by improving a company’s agility and its ability to enhance products, target customers more effectively or gain other operational insights.”

Here are some examples of how you can turn forecasting into a competitive advantage:

  • Use demand planning to anticipate the likely effects of variables such as marketing campaigns, market conditions in a given region, price discounts and more.
  • Generate stronger insights from a greater volume and variety of data to replace gut instinct and ensure more confidence in the numbers and advice coming from the Office of Finance
  • Develop insights into how markets are likely to evolve in order to enhance product offerings and target customers more effectively
  • Use scenario modeling to explore potential outcomes and identify the activities that have the greatest effect on your business
  • Analyze accounts receivable to create profiles that rank customers in the likelihood of them paying invoices promptly
  • Apply point-of-sale data to optimize inventory levels to adjust purchases from suppliers

As the report states, “the growing use of analytics to enhance forecasting represents the latest development in the increasing recognition that an organization’s data has evolved from a byproduct of its interactions with customers and stakeholders into a powerful source of organizational value.”

Home » Financial Performance Management » Page 42

Filed Under: News & Events Tagged With: Advanced Analytics, Analytics, Budgeting, Data Science, Financial Performance Management, Predictive Analytics

IBM Planning Analytics Tips & Tricks: Converting Reports to PAx

December 19, 2017 by Revelwood Leave a Comment

Tips & Tricks

This is a guest blog post by Revelwood’s Nicole Frigo.

Did you know you can easily convert existing Perspective reports to IBM Planning Analytics for Excel (PAx)? Converting reports and upgrading action buttons require just a few simple steps when transitioning to PAx. Here’s what you need to do:

1. Open PAx and connect into your Planning Analytics environment

Learn how to convert Perspective reports to PAx

2. Once connected, select Options on the Planning Analytics ribbon and select Upgrade Action Buttons

Easily convert existing Perspective reports to PAx
How to convert Perspective reports to PAx

3. You will have the option to create a backup and select a location for the backup. You will also be prompted to select a location for conversion logs.  It is important to note the once converted, action buttons will no longer work in Perspectives so it is highly recommended to both create a backup and to define a log directory.

Did you know you can convert Perspective reports to PAx?

Once the directories are selected, click OK. You will then be prompted to navigate to the file location. Select the file(s) to be upgraded and click Upgrade.

Perspective reports into PAx

4. After converting, you will need to publish the new workbook so others have access. To do this, the workbook must be saved first as a Macro Enabled Workbook or .xlsm

5. Once saved, you can publish workbooks back up to the server by selecting Publish on the Planning Analytics ribbon

Converting Perspective reports to PAx

IBM Planning Analytics, which TM1 is the engine for,  is full of new features and functionality. Not sure where to start?  Our team here at Revelwood can help.  Contact us for more information at info@revelwood.com.  And stay tuned for more Planning Analytics Tips & Tricks weekly in our Knowledge Center and in upcoming newsletters!

Read more IBM Planning Analytics Tips & Tricks blog posts:

Tips & Tricks for using IBM Planning Analytics: Creating URLs for TM1 Websheets

Tips & Tricks for using TM1: Variance Analysis in IBM Cognos TM1

IBM Planning Analytics: Using the Full Power of MDX

Home » Financial Performance Management » Page 42

Filed Under: IBM Planning Analytics Tips & Tricks Tagged With: Budgeting, Financial Performance Management, IBM Planning Analytics, Planning & Reporting, TM1

IBM Planning Analytics Tips & Tricks: Custom landing pages for TM1 Web

December 12, 2017 by Revelwood Leave a Comment

Tips & Tricks

This is a guest blog post by Revelwood’s Susan Musselman.

Did you know you can not only set up a landing page for IBM Cognos TM1 Web, but you can also set up custom landing pages for different groups of users? Here’s a quick step-by-step guide to do this.

The landing page for users is set up in the }ClientSettings cube:

Learn how to set up custom landing pages in TM11 we

In the above example, George Washington will see the Main Portal when he logs in and Al Capone will see Portal-2.  There are 3 easy steps to set this up:

Create elements in the Control Cube and populate control cube to define the path of the portal pages: the }ClientSettings cube:

Setting up custom landing pages in TM1 Web

Create a WebPortal attribute in the }Client dimension and populate for your users:

IBM Planning Analytics Tips & Tricks: Custom Landing Pages in TM1 Web

Create a rule in the }ClientSettings cube to determine which websheet to use for each }Client based on the attribute in the }ElementAttributes_}Clients cube:

How to set up custom landing pages in TM1 Web

IBM Planning Analytics, which TM1 is the engine for,  is full of new features and functionality. Not sure where to start?  Our team here at Revelwood can help.  Contact us for more information at info@revelwood.com.  And stay tuned for more Planning Analytics Tips & Tricks weekly in our Knowledge Center and in upcoming newsletters!

Read more blog posts with Tips & Tricks for IBM Planning Analytics:

Tips & Tricks for using IBM Planning Analytics: Creating URLs for TM1 Websheets

IBM Planning Analytics Tips & Tricks: Creating Dynamic, Attractive Views and Dashboards

Tips & Tricks for using IBM Planning Analytics: Creating TM1/Planning Analytics Picklist Cubes

Home » Financial Performance Management » Page 42

Filed Under: IBM Planning Analytics Tips & Tricks Tagged With: Budgeting, Financial Performance Management, IBM Planning Analytics, Planning & Reporting, TM1

IBM Planning Analytics Tips & Tricks: Visualizing Data into Pie Charts

December 6, 2017 by Lee Lazarow Leave a Comment

Tips & Tricks

Did you know IBM Planning Analytics Workspace (PAW) allows you to visualize your data using a variety of charts and graphs, including the ability to display your results via a pie chart?  In order to create a pie chart, you must follow one simple rule: ensure that you have only one “measure” element on either the row or the column.

You can create a pie chart in PAW with three easy steps:

1. Ensure that a dimension is defined as the measure by right clicking on the cube name within Server Explorer and then selecting the option for properties.

Creating pie charts with IBM Planning Analytics Workspace

2. Create a view in PAW with either the rows or the columns displaying a single element from the measure dimension.

How to create pie charts with IBM Planning Analytics Workspace

3. Set your visualization type to be a pie.

How to create a pie chart with IBM Planning Analytics Workspace

The resulting display will appear as a pie chart:

Using IBM Planning Analytics Workspace to create pie charts

Once the pie chart is created, you can use PAW to change the appearance of the colors, the legend and other details.

IBM Planning Analytics is full of new features and functionality. Not sure where to start?  Our team here at Revelwood can help.  Contact us for more information at info@revelwood.com.  And stay tuned for more Planning Analytics Tips & Tricks weekly in our Knowledge Center and in upcoming newsletters!

Home » Financial Performance Management » Page 42

Filed Under: IBM Planning Analytics Tips & Tricks Tagged With: Budgeting, Financial Performance Management, IBM Planning Analytics, Planning & Reporting, TM1

Tips & Tricks for Using TM1 – Variance Analysis in IBM Cognos TM1

November 22, 2017 by Revelwood Leave a Comment

Tips & Tricks

This is a guest blog post by Revelwood’s Susan Musselman.

Did you know many companies find it beneficial to do a variance analysis to identify differences between the planned financial outcomes and the actual financial outcomes? Many clients prefer to store account balances in IBM Cognos TM1 using positive values unless the value is contra to the account. For example: even though revenue is a credit value in the General Ledger, it is shown as a positive number on a P&L report. Costs are also shown as positive and then subtracted from Revenue to get Gross Profit.

To get a variance amount, Budget is subtracted from Actual. This results in a correct variance for Revenue. For example: if budgeted revenue is $15,000 and actual Revenue is $20,000 then the variance would be a positive $5,000, which is correct because higher revenue is a good thing. However, if we use the same calculation for cost then the variance is backwards. For example:  if budgeted cost is $5,000 and actual cost is $8,000 then the difference calculates to positive $3,000. However, a higher cost is not good so the number should be displayed as a negative.

Learn how to conduct variance analysis in IBM Cognos TM1

One solution would be to use a different formula for every row on every variance report that is created. However, this solution would require a lot of manually created rules that will slow down your overall TM1 application. A better solution would be to create a generic rule that can calculate the correct variance based on an attribute. To do this, first create an attribute in the Account dimension and populate the value with a 1 or -1 for every account. You can populate the attribute via rule to avoid future maintenance to the model.

Here is an example of some attributes values (please note that the attribute is populated for all levels of elements, including consolidations):

Calculate variances in IBM Cognos TM1

Next, create an element in your version dimension called “variance”. You can then create a rule for the new version to calculate the variance.

Learn how to calculate variances in IBM Cognos TM1

This gives the correct results:

Learn an easy approach to calculating variances in IBM Cognos TM1

Now the variance element can be used in any report!

IBM Planning Analytics, which TM1 is the engine for,  is full of new features and functionality. Not sure where to start?  Our team here at Revelwood can help.  Contact us for more information at info@revelwood.com.  And stay tuned for more Planning Analytics Tips & Tricks weekly in our Knowledge Center and in upcoming newsletters!

Read more blog posts on Tips & Tricks for IBM Planning Analytics and IBM Cognos TM1:

Tips & Tricks for IBM Planning Analytics: Creating URLs for TM1 Websheets

Tips & Tricks for IBM Planning Analytics: Creating TM1/Planning Analytics Picklist Cubes

IBM Planning Analytics: Using the Full Power of MDX

Home » Financial Performance Management » Page 42

Filed Under: IBM Planning Analytics Tips & Tricks Tagged With: Budgeting, Financial Performance Management, IBM Planning Analytics, Planning & Reporting, TM1

IBM Planning Analytics Tips & Tricks- Creating Dynamic, Attractive Views and Dashboards

November 1, 2017 by Nina Inverso Leave a Comment

Tips & Tricks

Did you know IBM Planning Analytics Workspace (PAW) allows you to create dynamic, attractive views and dashboards? With the vast number of stylistic options available, there are a few key tips that can be used to create a fluid user experience.

Use the “Caption” alias for dimension names.

The “Caption” alias can be modified for each dimension in the }DimensionAttributes cube. Once you’ve assigned a user-friendly name, or caption, to a dimension, this value will appear in your Planning Analytics Books in place of the dimension’s original name. The caption can then be updated at any point.

Use selector elements to ensure a uniform user experience.

Create selector elements when all users may not have access to all elements in the dimension. For instance, create an element in the department dimension called “Select a Department” and give everyone security to this new element. You can then set the new element as the starting point. When users open the dashboard, they will not see any data and will then be able to select elements based on their security rights.

Synchronize dimensions throughout the Book and individual Sheets.

Once you’ve created a new Book, you can synchronize the data using the “Synchronization scope” option in the Properties dropdown. The Properties button is located in the upper right-hand corner of the screen when you are in edit mode (image below). You have the choice to synchronize across the Book or Sheet, meaning an element selection can be carried across multiple visualizations to allow for uninterrupted data access.

For more information on Planning Analytics Workspace, refer to the IBM Planning Analytics 2.0.0 documentation.

IBM Planning Analytics is full of new features and functionality. Not sure where to start? Our team here at Revelwood can help. Contact us for more information at info@revelwood.com. And stay tuned for more Planning Analytics Tips & Tricks weekly in our Knowledge Center and in upcoming newsletters!

Home » Financial Performance Management » Page 42

Filed Under: IBM Planning Analytics Tips & Tricks Tagged With: Budgeting, Financial Performance Management, IBM Planning Analytics, PAx, Planning & Reporting, TM1

The Hackett Group Finds Performance Management in the Cloud is Gaining Momentum

October 24, 2017 by Lisa Minneci Leave a Comment

News & Events

A research study from The Hackett Group found that the adoption of performance management in the cloud is “set to rise significantly in the next couple of years.” The firm considers the momentum to be driven by the fact that performance management in the cloud solutions are “cost-effective, flexible and streamlined, while allowing more people to participate in the planning process.” The research shows that 72% of companies are either planning or exploring an implementation of a cloud-based financial planning or business intelligence solution.

The report lists several reasons for the growing adoption of performance management in the cloud, but there are two particular drivers that are quite interesting – they go beyond the “traditional” list of factors. These two reasons are:

  • “They are reacting to the entry of major vendors in the cloud.” While there’s been plenty of hype around cloud-based financial planning and budgeting solutions for several years now, The Hackett Group states that “they have been offered mostly by midsize vendors and adopted by midsize companies as a cost-effective alternative for full-fledged, on-premise applications.”
  • “They can better adapt to change and fiercer competition.” According to The Hackett Group, “Finance needs to generate data-driven decision support so the business can rapidly adapt amid volatile market conditions. The onus is on FP&A teams to put in place an infrastructure that lets them gather data from multiple sources and apply analytics in real time, while shaving days off core budgeting, forecasting and planning processes. Waiting for new functionality is not an acceptable option.”

The report also delves into how to extract the efficiencies of cloud solutions, whether or not to customize a cloud-based solution (or to what extent), and a mini case study of why one company selected to go with a cloud-based, versus on-premise, performance management solution.

Home » Financial Performance Management » Page 42

Filed Under: News & Events Tagged With: Budgeting, Financial Performance Management, Planning & Reporting

  • « Go to Previous Page
  • Page 1
  • Interim pages omitted …
  • Page 40
  • Page 41
  • Page 42
  • Page 43
  • Page 44
  • Interim pages omitted …
  • Page 47
  • Go to Next Page »

Footer

Revelwood Overview

Revelwood helps finance organizations close, consolidate, plan, monitor and analyze business performance. As experts in solutions for the Office of Finance, we partner with best-in-breed software companies by applying best practices guidance and our pre-configured applications to help businesses achieve their full potential.

EXPERTISE

  • Workday Adaptive Planning
  • IBM Planning Analytics
  • BlackLine

ABOUT

  • Who We Are
  • What We Do
  • How We Help
  • How We Think
  • Privacy

CONNECT

World Headquarters

Florham Park, NJ | 201 984 3030

European Headquarters

London & Edinburgh | +44 (0)131 240 3866

Latin America Office

Miami, FL | 201 987 4198

Email
info@revelwood.com

Copyright © 2025 · Revelwood Inc. All rights reserved. Revelwood® and the Revelwood logo are registered marks of Revelwood Inc.