• Skip to main content
  • Skip to footer
Revelwood Logo

Revelwood

Your SUPER-powered WP Engine Site

  • Who We Are
    • About Us
      • Our Company
      • Our Team
      • Partners
    • Careers
      • Join Our Team
  • What We Do
    • Solutions
      • Workday Adaptive Planning
      • IBM Planning Analytics
      • BlackLine
    • Services
      • Implementation Services
      • Customer Care
        • Help Desk
        • System Administration as a Service
      • Training
        • Workday Adaptive Planning Training
        • IBM Planning Analytics / TM1 Training
    • Products
      • DataMaestro
      • LightSpeed
      • IBM Planning Analytics Utilities
  • How We Help
    • Use Cases
    • Client Success Stories
  • How We Think
    • Knowledge Center
    • Events
    • News
  • Contact Us

IBM Planning Analytics PAW

IBM Planning Analytics Tips & Tricks: PAW Chart Padding

June 29, 2021 by Lee Lazarow Leave a Comment

Did you know that IBM Planning Analytics Workspace (PAW) offers a feature calling “padding” which defines lines are separated within a chart? The concept of padding is the equivalent of defining white space in between the lines (e.g., no padding) or making the lines touch the lines above and below (e.g., padding).

The setting is located within the chat area of the visualization properties. It is defined as a binary option so you can choose to enable it or disable it.

IBM Planning Analytics Tips & Tricks: PAW Chart Padding

Here is an example of the same chart via both options. The chart on the top has padding enabled (e.g., the option is not checked) and the chart on the bottom has padding disabled.

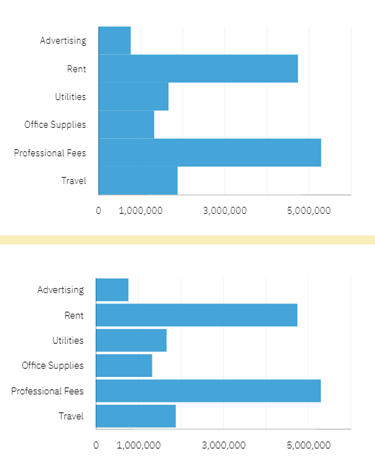
By defining whitespace around your charts, you make your data more readable.

IBM Planning Analytics, powered by TM1, is full of new features and functionality. Need advice? Our team here at Revelwood can help. Contact us for more information at info@revelwood.com. We post new Planning Analytics Tips & Tricks weekly in our Knowledge Center and in newsletters.

Read more IBM Planning Analytics Tips & Tricks:

IBM Planning Analytics Tips & Tricks: Pie Chart Sizing

IBM Planning Analytics Tips & Tricks: IBM Planning Analytics Workspace Tab Icons

IBM Planning Analytics Tips & Tricks: IBM Planning Analytics Workspace Tab Colors

Home » IBM Planning Analytics PAW

Filed Under: IBM Planning Analytics Tips & Tricks Tagged With: Cognos, enterprise performance management, enterprise planning, Financial Performance Management, IBM Planning Analytics, IBM Planning Analytics charts, IBM Planning Analytics PAW, IBM Planning Analytics Workspace, TM1

Footer

Revelwood Overview

Revelwood helps finance organizations close, consolidate, plan, monitor and analyze business performance. As experts in solutions for the Office of Finance, we partner with best-in-breed software companies by applying best practices guidance and our pre-configured applications to help businesses achieve their full potential.

EXPERTISE

  • Workday Adaptive Planning
  • IBM Planning Analytics
  • BlackLine

ABOUT

  • Who We Are
  • What We Do
  • How We Help
  • How We Think
  • Privacy

CONNECT

World Headquarters

Florham Park, NJ | 201 984 3030

European Headquarters

London & Edinburgh | +44 (0)131 240 3866

Latin America Office

Miami, FL | 201 987 4198

Email
info@revelwood.com

Copyright © 2025 · Revelwood Inc. All rights reserved. Revelwood® and the Revelwood logo are registered marks of Revelwood Inc.