• Skip to main content
  • Skip to footer
Revelwood Logo

Revelwood

Your SUPER-powered WP Engine Site

  • Who We Are
    • About Us
      • Our Company
      • Our Team
      • Partners
    • Careers
      • Join Our Team
  • What We Do
    • Solutions
      • Workday Adaptive Planning
      • IBM Planning Analytics
      • BlackLine
    • Services
      • Implementation Services
      • Customer Care
        • Help Desk
        • System Administration as a Service
      • Training
        • Workday Adaptive Planning Training
        • IBM Planning Analytics / TM1 Training
    • Products
      • DataMaestro
      • LightSpeed
      • IBM Planning Analytics Utilities
  • How We Help
    • Use Cases
    • Client Success Stories
  • How We Think
    • Knowledge Center
    • Events
    • News
  • Contact Us

IBM Planning Analytics

IBM Planning Analytics Tips & Tricks: How to Set Up Synchronizations in IBM Planning Analytics Workspace

November 29, 2022 by Dillon Rossman

Revelwood’s latest IBM Planning Analytics Tips & Tricks video features Dillon Rossman, a consultant with our IBM Planning Analytics practice, demonstrating how to set up synchronizations in Planning Analytics Workspace (PAW).

In this video, Dillon walks you through how to:

  • Change an exploration to a pie chart
  • Edit the synchronization properties
  • Select the dimensions you want to be synchronized
  • Perform synchronizations on both a sheet and a book

Revelwood has worked with IBM Planning Analytics / TM1 for more than 27 years. We’ve partnered with hundreds of companies on the design, development, maintenance and updates of IBM Planning Analytics applications, across every industry. Have a challenge with Planning Analytics / TM1? We can help you!

Watch more IBM Planning Analytics Tips & Tricks:

IBM Planning Analytics Tips & Tricks: Filtering in Planning Analytics

IBM Planning Analytics Tips & Tricks: Global Settings in Overview

IBM Planning Analytics Tips & Tricks: Color in Planning Analytics

Home » IBM Planning Analytics » Page 12

Filed Under: IBM Planning Analytics Tips & Tricks Tagged With: IBM Cognos TM1, IBM Planning Analytics, Planning & Forecasting, TM1

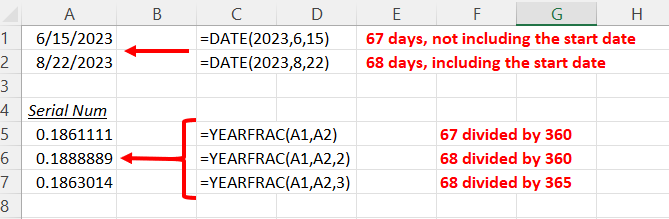
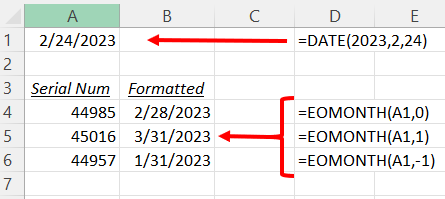
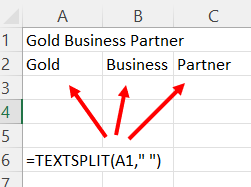
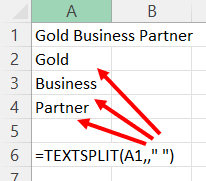
IBM Planning Analytics Tips & Tricks: Excel SEQUENCE

November 22, 2022 by Lee Lazarow

Have you ever needed to quickly generate a list of numbers? Maybe you need to create a list from 1-100. Maybe you want to create a list of the first 100 even numbers. Maybe you want to create those same lists in descending order. Did you know that Excel has a function called SEQUENCE which allows you to quickly create these lists?

The SEQUENCE function is used to generate an array of sequential numbers.  The syntax of the function is:

=SEQUENCE (rows, [columns], [start], [step])

  • Rows (required)
    • This is the number of rows to be filled
  • Columns (optional)
    • This is the number of columns to be filled
    • If skipped, this defaults to 1
  • Start (optional)
    • This is the starting number in the sequence
    • If skipped, this defaults to 1
  • Step (optional)
    • This is the increment for each subsequent value
    • If skipped, this defaults to 1
    • This can be negative to provide a descending list

The following example shows a single column list from 1-10

Chart

Description automatically generated with medium confidence

The same formula doubles the result when the column parameter is defined. Note that the results read from right to left (e.g., the entire row) and then goes down.

Table

Description automatically generated with medium confidence

Here is the same formula when adding both a starting value and an increment.

Table

Description automatically generated

Not only can this formula be used to quickly generate lists, but it can also be used as part of a combination:

  • With the DATE formula to define a calendar
  • With the TIME formula to create a daily schedule
  • With data from another column to create unique IDs for items like products or employees

Read more IBM Planning Analytics Tips & Tricks:

IBM Planning Analytics Tips & Tricks: Creating Control Objects from the Modeling Workbench

IBM Planning Analytics Tips & Tricks: Shortcuts in PAW Models

IBM Planning Analytics Tips & Tricks: Customizing Background Colors for Data and Header Cells

Home » IBM Planning Analytics » Page 12

Filed Under: IBM Planning Analytics Tips & Tricks Tagged With: Financial Performance Management, IBM Cognos TM1, IBM Planning Analytics, IBM Planning Analytics Tips & Tricks, TM1

IBM Planning Analytics Tips & Tricks: PAW Go To Line in Process

November 15, 2022 by Lee Lazarow

Sometimes your TurboIntegrator scripts can become very long. While it’s nice to be able to scroll up and down throughout your code, there are times that you may want to go directly to a specific line. IBM Planning Analytics Workspace (PAW) version 79 allows this via the “Go to Line” button.

Once clicked, you are prompted to select a section and a line within the section.  

When defining a line, note that the line numbers restart within each section. In the example below, each set of generated statement lines begin at line 2 (since I like to skip a line for easy reading) and the first line of code in the Data section begins at line 5.

This approach will help you speed up your navigation as you write code in TurboIntegrator.

Revelwood has worked with IBM Planning Analytics / TM1 for more than 27 years. We’ve partnered with hundreds of companies on the design, development, maintenance and updates of IBM Planning Analytics applications, across every industry. Have a challenge with Planning Analytics / TM1? We can help you!

Read more IBM Planning Analytics Tips & Tricks:

IBM Planning Analytics Tips & Tricks: Planning Analytics Workspace Borders in Preview

IBM Planning Analytics Tips &Tricks: Rounded Buttons in Planning Analytics Workspace

IBM Planning Analytics Tips & Tricks: MDX Syntax Explained

Home » IBM Planning Analytics » Page 12

Filed Under: IBM Planning Analytics Tips & Tricks Tagged With: Financial Performance Management, IBM Cognos TM1, IBM Planning Analytics, IBM Planning Analytics Tips & Tricks, TM1

FP&A Done Right: Approaches to Long-Term Planning

November 14, 2022 by Lee Lazarow

“If you fail to plan, you are planning to fail.” – Ben Franklin

In our collective rush to react to ever-changing marketplace dynamics and shifts in the economy, it’s easy to focus on short-term plans, to the neglect of long-term planning. Today’s leaders need to have several plans – short-term, medium-term, and long-term.

Different plans for different needs

How do these plans differ? A short-term plan is designed to show granular details for a limited time frame. This is often updated monthly, although we have some clients updating their plans on a weekly basis. One of our clients follows a process where local managers update their plans on Mondays and Tuesdays, have the regional managers review the data on Thursdays, and allow senior management to analyze and assess the data on Fridays. Each Monday they start the process over.

Most organizations utilize a medium-term plan that looks out anywhere from a few quarters to a full year. Most people will think of this as a standard monthly forecast with data at a bit more of a higher level, but still somewhat details.

A long-term plan often goes out multiple years. Many companies create a 5-year plan, although some industries such as entertainment and pharmaceutical often create 20-25 year plans. A long-term plan is a high-level view of the business. It’s not nearly as granular as short, or even medium-term plans. The plan does not get down to the level of looking at a GL account or a customer. It’s a measuring tool and a defined way of reviewing the progress of the company. In short, long-term planning helps to set the company’s direction.

The essentials of long-term planning

The long-term plan gives you guidance on how to answer several questions, including:

  • How can we expand the company?
  • How can we look into acquisitions?
  • What products, geographies, and verticals can we or should we add?
  • What products no longer make sense?
  • How do debt payments impact cash flow?
  • What type of labor, buildings, locations, and equipment do we need?

A long-term plan can be considered a proactive approach to risk mitigation, enabling companies to plan, think ahead, prepare for, and lessen the impact of potential negative effects. At Revelwood, we recommend two approaches to long-term planning: the growth percent approach and a driver-based approach.

We often see both of these methods used when performing long-term planning in IBM Planning Analytics with Watson:

Growth percent approach

The growth percent approach allows you to adjust groups of data (accounts, departments, etc.) by increasing or decreasing the values from the previous year. Some clients prefer to simply use a single percentage (example: reduce all expenses by 2% each year for the next five years) whereas some clients prefer to include more variation (example: reduce utilities expenses by 2% next year, by 3% the following year, and by 4% for the next three years). But no matter what level of detail is used, Planning Analytics’ powerful scripting tool will perform the entire long term plan in a matter of seconds.

Driver-based approach

A driver-based approach uses operational activity to calculate key variable revenues and expenses. This approach allows you to simplify the input by defining a set of drivers and creating calculations that use the drivers.  For example, a single driver of “units sold” can be used to immediately calculate revenue, COGS, and some of your variable expenses using the tool’s efficient calculation engine.

Mitigate risk with long-term planning

Long-term planning is your company’s assurance against planning to fail. There’s a reason why Franklin’s quote has lasted through the years. And it should be the motto of every planning team.

Learn more about long-term planning by watching our on-demand webinar – Long-Term Planning in IBM Planning Analytics.

This post originally appeared on IBM’s Journey to AI blog.

Home » IBM Planning Analytics » Page 12

Filed Under: FP&A Done Right Tagged With: Budgeting Planning & Forecasting, Financial Performance Management, IBM Planning Analytics, Planning & Reporting, TM1

IBM Planning Analytics Tips & Tricks: Planning Analytics Workspace Borders in Preview

November 1, 2022 by Lee Lazarow

Tips & Tricks

IBM Planning Analytics Workspace (PAW) allows you to easily create selector widgets that can be used for updating the data in your PAW book. This is done by adding a dimension as a selector widget.

You can edit the list of elements (e.g., the set) and the way the list appears. The selector widget allows you to easily select an element that is synchronized to your charts and explorations. When selecting the element, a border appears around the widget.

Diagram

Description automatically generated with low confidence

While this border offers features such as the ability to expand the screen, it clearly makes the list into a separate section of the page. You can remove the border by using the property called “Show selected border in preview” (within the area called General, Appearance). Here is the same list without the border enabled:

Text

Description automatically generated

This property will allow you to create the perception of a single page and not a set of independent objects.

Revelwood has worked with IBM Planning Analytics / TM1 for more than 27 years. We’ve partnered with hundreds of companies on the design, development, maintenance and updates of IBM Planning Analytics applications, across every industry. Have a challenge with Planning Analytics / TM1? We can help you!

Read more IBM Planning Analytics Tips & Tricks:

IBM Planning Analytics Tips &Tricks: Rounded Buttons in Planning Analytics Workspace

IBM Planning Analytics Tips & Tricks: MDX Syntax Explained

IBM Planning Analytics Tips & Tricks: Global Settings in Overview Area of Exploration

Home » IBM Planning Analytics » Page 12

Filed Under: IBM Planning Analytics Tips & Tricks Tagged With: IBM Cognos TM1, IBM Planning Analytics, IBM Planning Analytics Tips & Tricks, Planning & Forecasting, TM1

BARC Score Report Ranks IBM & Workday as Leaders in Integrated Planning & Analytics

October 28, 2022 by Revelwood

News & Events

The 2022 BARC Score named IBM and Workday as leaders in Integrated Planning & Analytics. BARC (Business Analytics Research Center) is one of Europe’s leading analyst firms for business software, focusing on the areas of data, business intelligence (BI) and analytics, corporate performance management (CPM), enterprise content management (ECM), customer relationship management (CRM) and enterprise resource planning (ERP).

This BARC Score report focuses on the market for integrated planning and analytics (IP&A) products and portfolios. 

“Today, the reality in many companies is that IP&A is an often proclaimed but seldom achieved goal. Reasons such as internal policies or difficulties with historically grown system landscapes could account for this … However, the lack of coherence of data and functionality resulting from using multiple tools for planning and analytics, and using Excel instead of specialized software tools, are frequently cited reasons for user dissatisfaction, inconsistencies and error susceptibility with planning and analytics in companies today,” writes BARC.

BARC Score – IBM

BARC assessed several components of IBM’s “comprehensive portfolio of on-premises and cloud analytics and performance management solutions,” which includes IBM Cognos Analytics with Watson and IBM Planning Analytics with Watson. The BARC Score states:

  • IBM Planning Analytics offers flexibility for business power users to create budgeting, planning and forecasting as well as analytics applications based on a high-performance in-memory database.
  • Comprehensive Excel-based functionality for preparing individual applications in IBM Planning Analytics (modeling, custom planning forms, etc.) and publishing them to the web.

BARC Score – Workday

This report focuses on Workday Analytics Planning, describing it as “a business-user-oriented CPM platform with functionality for various performance management processes.” BARC lists the following among the strengths for Workday Adaptive Planning:

  • Flexibility for a wide variety of planning approaches (centralized top-down, decentralized bottom-up) and planning topics (including operational planning and financial planning) aimed at companies of all sizes and industries.
  • According to feedback in BARC’s “The Planning Survey,” customers are very satisfied with Workday Adaptive Planning, its price to value and its planning and workflow functionality. 

BARC Score Inclusion Criteria

BARC has two categories for being included in this report: 

  • The vendor’s products and portfolios
  • Financial results relating to those products

Vendors included in the report must have functionality for planning, as well as:

  • Formatting reporting
  • Ad hoc query and reporting
  • Analysis 
  • Dashboards

All vendors must generate a minimum of 20 million EUR of software revenue per year, have a presence in Europe and in at least two additional geographies. The product must also have a significant number of implementations.Learn more about BARC’s assessment of IBM Planning Analytics and Workday Adaptive Planning. Download your copy today.

Home » IBM Planning Analytics » Page 12

Filed Under: News & Events Tagged With: IBM Planning Analytics, TM1, Workday, Workday Adaptive Planning

IBM Planning Analytics Tips &Tricks: Rounded Buttons in Planning Analytics Workspace

October 25, 2022 by Lee Lazarow

IBM Planning Analytics Workspace (PAW) allows you to easily create buttons that can be used for navigation and to run TurboIntegrator (TI) scripts. This is done by dragging the Action Button widget onto the sheet.

By default, the button appears as a rectangle.  

Shape

Description automatically generated

You can make the button more rounded by using the property called “Corner Radius” (within the area called General, Appearance).  Here is the same button with a corner radius setting of 90:

Shape, rectangle

Description automatically generated

You can also update the height of the button to make it appear even more rounded:

Shape, circle

Description automatically generated

From there, you can further customize the formatting associated with colors, fonts, and text size.

This property will allow you to define various ways to incorporate simple “press this button to…” approaches within your PAW books.

Revelwood has worked with IBM Planning Analytics / TM1 for more than 27 years. We’ve partnered with hundreds of companies on the design, development, maintenance and updates of IBM Planning Analytics applications, across every industry. Have a challenge with Planning Analytics / TM1? We can help you!

Read more IBM Planning Analytics Tips & Tricks:

IBM Planning Analytics Tips & Tricks: Working with Two Time Zones in Google Calendar

IBM Planning Analytics Tips & Tricks: New Filter Option in Set Editor

IBM Planning Analytics Tips & Tricks: 21/21/21

Home » IBM Planning Analytics » Page 12

Filed Under: IBM Planning Analytics Tips & Tricks Tagged With: Financial Performance Management, IBM Cognos TM1, IBM Planning Analytics, Planning & Forecasting, TM1

Three Reasons You Need IBM Planning Analytics / TM1 Training

October 21, 2022 by Revelwood

Whether you are new to IBM Planning Analytics / TM1 or you consider yourself an all-star, you could still benefit from training. Over our 27+ years of designing, implementing and maintaining IBM Planning Analytics / TM1 applications and environments, we’ve found there are three primary reasons for investing in training. 

1. Staff Turnover in the Office of Finance

According to Gartner, the U.S. total annual turnover rate will jump by nearly 20% from the pre-pandemic average. Maybe your Planning Analytics administrator left your organization. Maybe your organization is growing rapidly and needs to add more TM1 developers and administrators. Regardless of the reasons, training is a smart move when you have new team members joining the organization or taking on new roles in your company.

People often give their employers two weeks’ notice that they are leaving their job. That does not leave enough time for a company to hire a new employee for the position. Even if you are temporarily assigning the role to a current employee, two weeks is still not enough time to get up and running on your Planning Analytics / TM1 implementation. 

There’s also an additional complication – how accurate and up-to-date is your Planning Analytics documentation? Old and out-of-date documentation makes it even more difficult for new TM1 administrators and developers to get up to speed. 

2. Expanding use of Planning Analytics / TM1 to Extended Planning & Analysis (xP&A)

xP&A is an enterprise planning strategy that combines and extends financial and operational planning. Gartner describes it as “taking the F out of FP&A).” xP&A offers “cross-organization leaders an ‘extended,’ holistic view of their company’s operations so that they can pivot the business with greater agility and more rapidly model future business scenarios.” [Gartner].

This can mean using IBM Planning Analytics / TM1 for:

  • Human resources
  • Sales
  • Marketing
  • Operations
  • Supply Chain
  • IT
  • Research and development

There are many benefits to xP&A. The business unit leaders in these functional areas may not be the Excel experts that the Office of Finance are. Before rolling out Planning Analytics applications to other areas, you should make sure new developers and end users receive training. It will make a significant positive impact on your roll out and eventual user adoption and satisfaction. 

3. Upgrading from TM1 to Planning Analytics

Migrating from TM1 to Planning Analytics is a big opportunity to modernize your planning environment. It’s not just a standard update or migration. You’ll learn a new, rich data exploration and visualization experience in Planning Analytics Workspace. You’ll have a new Excel add-in, Planning Analytics for Excel (PAx). And you’ll leverage hierarchies – the ability to turn attributes into dimensions for faster and more flexible data analysis.

Migrating to Planning Analytics requires training. Planning Analytics is powered by TM1 but delivers a whole new environment for your planning activities.

Revelwood’s Planning Analytics / TM1 Training Options

Revelwood has offered TM1 and Planning Analytics training for decades. We’ve refined our approach, expanded our best practices, and have the answers to all your TM1 and Planning Analytics questions. 

We offer several options for training, including: 

  • IBM Planning Analytics Fundamentals
  • IBM Planning Analytics Custom Report Building
  • Personalized Training Courses, working with your data and environment. Example courses include:
    • IBM Planning Analytics / TM1 Administrator Training
    • IBM Planning Analytics / TM1 Developer Training
    • TM1 10.2.2 and earlier versions User Training
    • Customized IBM Planning Analytics User Fundamentals Training
    • Customized IBM Planning Analytics Custom Report Building Training

All training options are virtual, enabling your team members worldwide to participate in training. Take advantage of our Planning Analytics experts! Contact us about training options.

Home » IBM Planning Analytics » Page 12

Filed Under: FP&A Done Right Tagged With: Financial Performance Management, IBM Planning Analytics, Planning & Forecasting, TM1

IBM Planning Analytics Tips & Tricks: MDX Syntax Explained

October 18, 2022 by Lee Lazarow

MDX enables you to query dimensions and cubes, lists of elements, data points, calculations, and more. 

The first step in learning MDX is to understand the syntax. Below is an example of an MDX expression that returns all elements of the product dimension sorted in ascending order. To understand the expression, we’ve color-coded the syntax below. 

Part1, the part that is associated with the TM1 structure and model, is in green. This defines cubes, dimensions, hierarchies, elements and more. 

Part 2, in blue, is the MDX Function.

Part 3 is in red. These are known as curly brackets or braces. These convert the results of the MDX Expression into a set. 

The Expression below lets you list all elements of the product dimension and sort the list in ascending order:

Graphical user interface, text, application, email

Description automatically generated

Revelwood recently hosted a webinar on How to Use MDX in your IBM Planning Analytics Environment. Watch the recording to learn more about using MDX.

Interested in learning more about MDX? We have another MDX-specific webinar on Wednesday, November 9, 2022 at 1pm ET. Attendees will learn advanced MDX functions and see real-life examples of how Revelwood used MDX to address complex reporting requirements and to solve client challenges. 

Have a question about MDX? Register for our upcoming webinar or reach out to us at info@revelwood.com

Revelwood has worked with IBM Planning Analytics / TM1 for more than 27 years. We’ve partnered with hundreds of companies on the design, development, maintenance and updates of IBM Planning Analytics applications, across every industry. Have a challenge with Planning Analytics / TM1? We can help you!

Read more IBM Planning Analytics Tips & Tricks on MDX:

IBM Planning Analytics Tips & Tricks: An Approach to Strengthening your MDX Skills

IBM Planning Analytics Tips & Tricks: Making Default Cube Views Dynamic with MDX

IBM Planning Analytics Tips & Tricks: Dynamic Subsets Based on a Cube

Home » IBM Planning Analytics » Page 12

Filed Under: IBM Planning Analytics Tips & Tricks Tagged With: Financial Performance Management, IBM Cognos TM1, IBM Planning Analytics, Planning & Reporting, TM1

  • « Go to Previous Page
  • Page 1
  • Interim pages omitted …
  • Page 10
  • Page 11
  • Page 12
  • Page 13
  • Page 14
  • Interim pages omitted …
  • Page 39
  • Go to Next Page »

Footer

Revelwood Overview

Revelwood helps finance organizations close, consolidate, plan, monitor and analyze business performance. As experts in solutions for the Office of Finance, we partner with best-in-breed software companies by applying best practices guidance and our pre-configured applications to help businesses achieve their full potential.

EXPERTISE

  • Workday Adaptive Planning
  • IBM Planning Analytics
  • BlackLine

ABOUT

  • Who We Are
  • What We Do
  • How We Help
  • How We Think
  • Privacy

CONNECT

World Headquarters

Florham Park, NJ | 201 984 3030

European Headquarters

London & Edinburgh | +44 (0)131 240 3866

Latin America Office

Miami, FL | 201 987 4198

Email
info@revelwood.com

Copyright © 2025 · Revelwood Inc. All rights reserved. Revelwood® and the Revelwood logo are registered marks of Revelwood Inc.