Did you know feeding based on string values can be tricky? Anyone that has developed in TM1/IBM Planning Analytics before knows full well the importance of a well-written feeder statement.
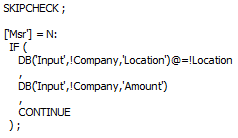
An example of this is when we have a cube with string measures that are dimensions in another cube. The pull side is quite simple:
The issue, however, is how Planning Analytics registers feeders:
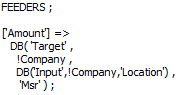
Numeric feeders only trigger once… during the first time the string in the cube “Input” is filled in. Therefore, the feeder above will initially work perfectly well. However, if that string ever changes, the new value will not be fed since TM1 doesn’t reprocess the feeder.
We need to instead have the string value feed the cell. We can do this by altering our feeders:
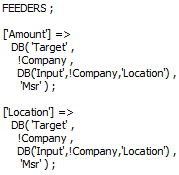
By adding the second feeder statement, it ensures that any changes in the string-based “Location” measure will trigger the new location. Don’t forget to include a FEEDSTRINGS command at the top of your rule!
IBM Planning Analytics is full of new features and functionality. Not sure where to start? Our team here at Revelwood can help. Contact us for more information at info@revelwood.com. And stay tuned for more Planning Analytics Tips & Tricks weekly in our Knowledge Center and in upcoming newsletters!
Read more blog posts with IBM Planning Analytics Tips & Tricks:
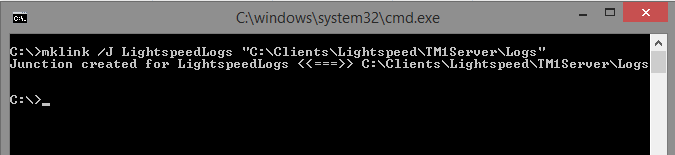
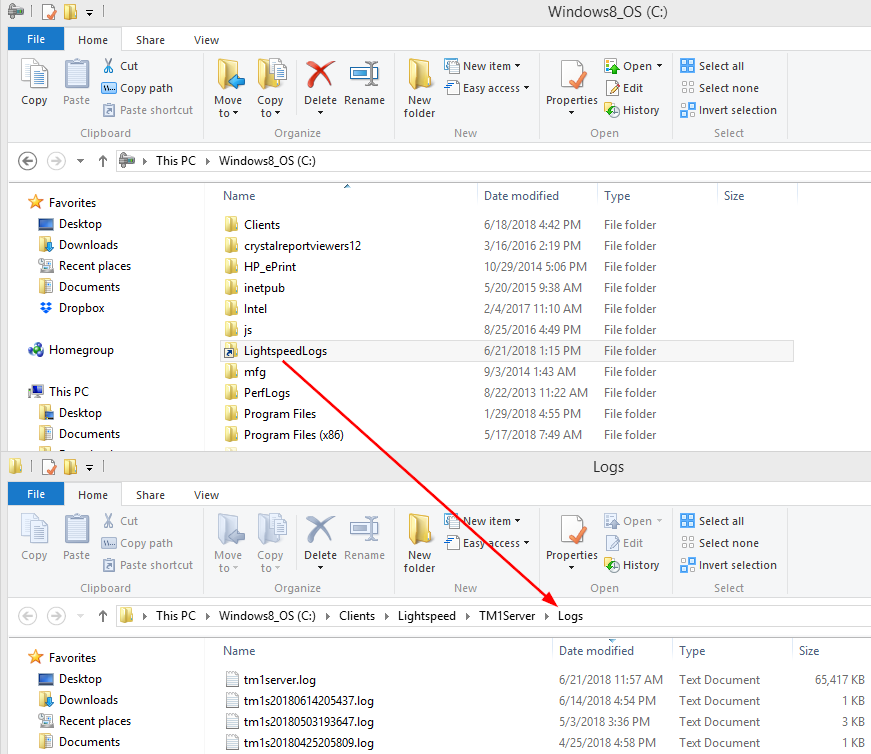
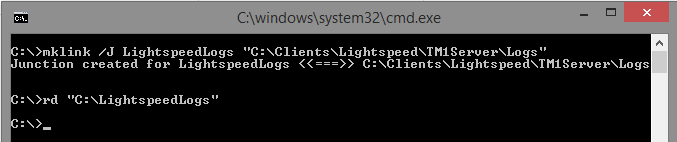
IBM Planning Analytics Tips & Tricks: Customizing PAW Directory Installation on Windows 2016
IBM Planning Analytics Tips & Tricks: New Parameters for TurboIntegrator
IBM Planning Analytics Tips & Tricks: Regions with Planning Analytics Rules